
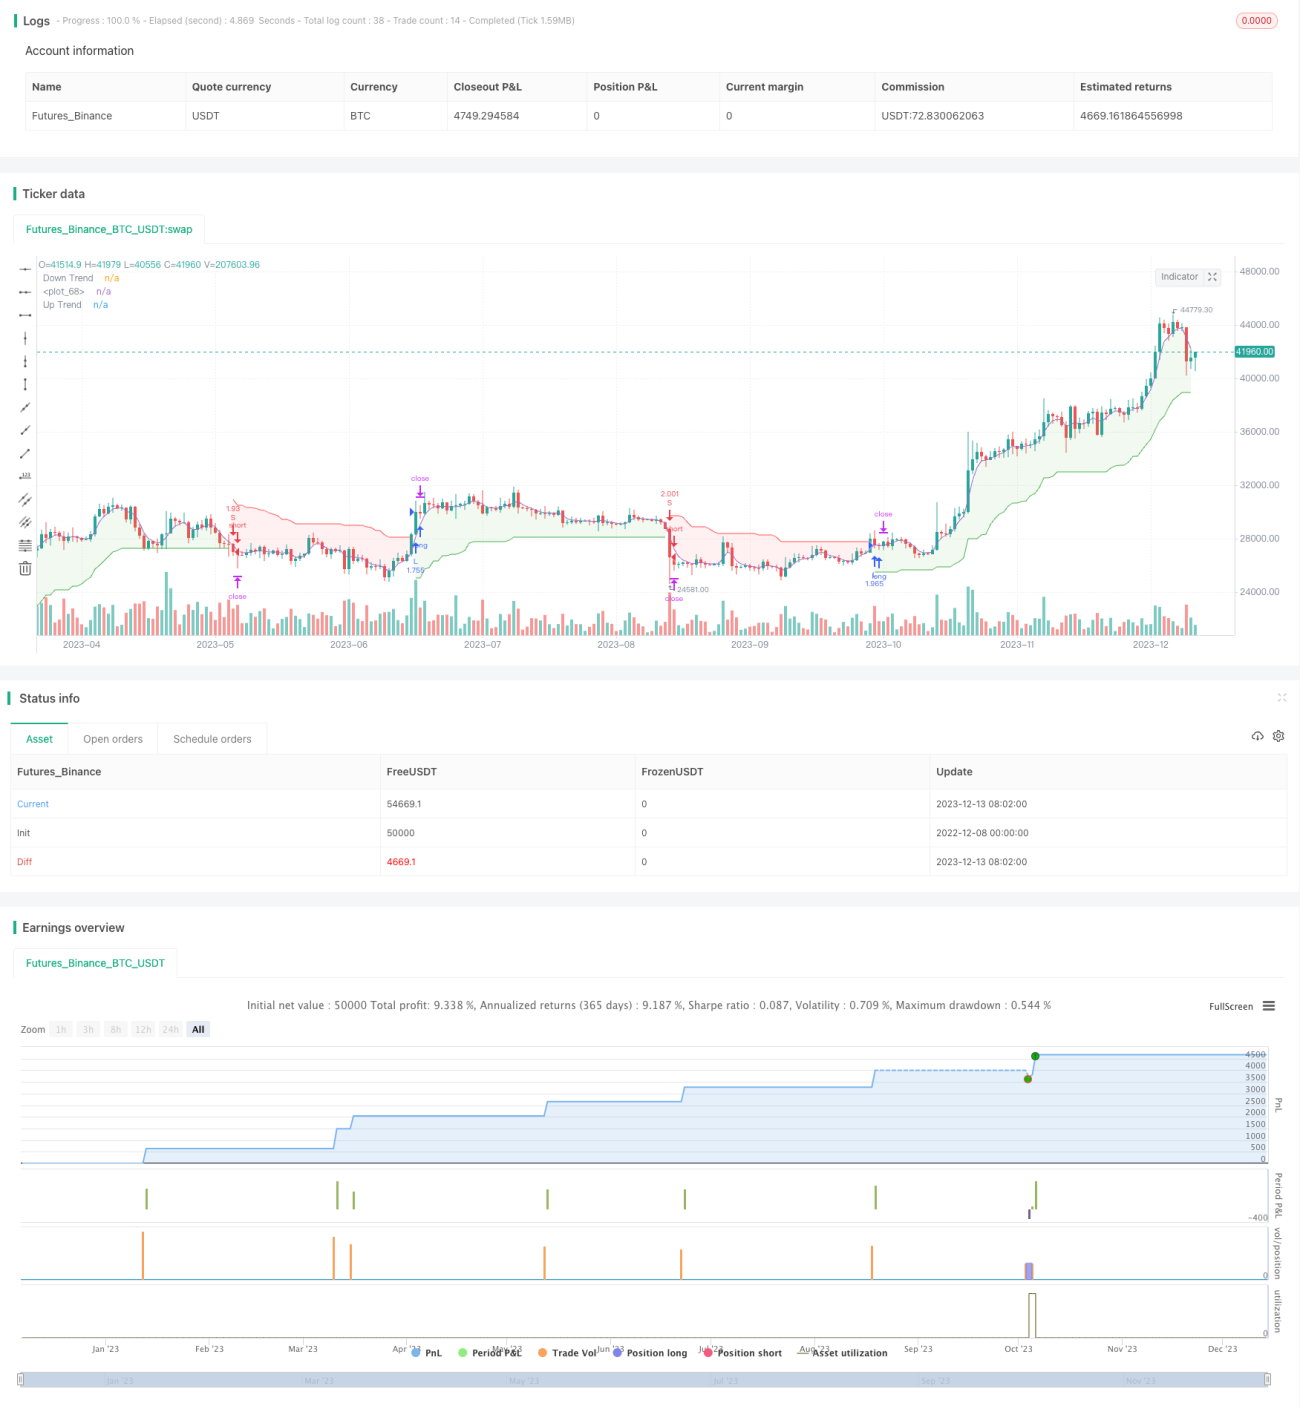
Ini adalah strategi perdagangan kuantitatif yang menggabungkan dua indikator Heiken Ashi dan Super Trend. Strategi ini terutama menggunakan Heiken Ashi Smooth K-Line untuk memfilter kebisingan pasar, dan indikator Super Trend untuk menentukan arah tren harga, untuk melakukan pelacakan tren.
Solusi: (1) Sesuai menyesuaikan parameter supertrend, menyeimbangkan efek pelacakan dan frekuensi masuk (2) Menambahkan indikator-indikator lain untuk membantu penilaian, menghindari masalah yang diakibatkan oleh lompatan udara
Strategi ini mengintegrasikan keuntungan Heiken Ashi dan supertrend dua indikator, menggunakan indikator untuk menentukan arah tren nilai, untuk melakukan pelacakan otomatis. Dibandingkan dengan menggunakan satu indikator, menilai pergerakan harga lebih efektif, meningkatkan stabilitas strategi. Tentu saja, ada juga ruang untuk perbaikan tertentu, di masa depan dapat dioptimalkan dari frekuensi masuk, stop loss, sehingga strategi mendapatkan keuntungan lebih tinggi, risiko lebih rendah.
/*backtest
start: 2022-12-08 00:00:00
end: 2023-12-14 00:00:00
period: 1d
basePeriod: 1h
exchanges: [{"eid":"Futures_Binance","currency":"BTC_USDT"}]
*/
// This source code is subject to the terms of the Mozilla Public License 2.0 at https://mozilla.org/MPL/2.0/
// © RingsCherrY
//@version=5
strategy("Heiken Ashi & Super Trend", overlay=true, pyramiding=1,initial_capital = 10000, default_qty_type= strategy.percent_of_equity, default_qty_value = 100, calc_on_order_fills=false, slippage=0,commission_type=strategy.commission.percent,commission_value=0.02)
///////////////////////////////////////////////////
////////////////////Function///////////////////////
///////////////////////////////////////////////////
heikinashi_open = request.security(ticker.heikinashi(syminfo.tickerid), timeframe.period, open)
heikinashi_high = request.security(ticker.heikinashi(syminfo.tickerid), timeframe.period, high)
heikinashi_low = request.security(ticker.heikinashi(syminfo.tickerid), timeframe.period, low)
heikinashi_close= request.security(ticker.heikinashi(syminfo.tickerid), timeframe.period, close)
heikinashi_color = heikinashi_open < heikinashi_close ? #53b987 : #eb4d5c
// plotbar(heikinashi_open, heikinashi_high, heikinashi_low, heikinashi_close, color=heikinashi_color)
x_sma(x, y) =>
sumx = 0.0
for i = 0 to y - 1
sumx := sumx + x[i] / y
sumx
x_rma(src, length) =>
alpha = 1/length
sum = 0.0
sum := na(sum[1]) ? x_sma(src, length) : alpha * src + (1 - alpha) * nz(sum[1])
x_atr(length) =>
trueRange = na(heikinashi_high[1])? heikinashi_high-heikinashi_low : math.max(math.max(heikinashi_high - heikinashi_low, math.abs(heikinashi_high - heikinashi_close[1])), math.abs(heikinashi_low - heikinashi_close[1]))
//true range can be also calculated with ta.tr(true)
x_rma(trueRange, length)
x_supertrend(factor, atrPeriod) =>
src = (heikinashi_high+heikinashi_low)/2
atr = x_atr(atrPeriod)
upperBand = src + factor * atr
lowerBand = src - factor * atr
prevLowerBand = nz(lowerBand[1])
prevUpperBand = nz(upperBand[1])
lowerBand := lowerBand > prevLowerBand or heikinashi_close[1] < prevLowerBand ? lowerBand : prevLowerBand
upperBand := upperBand < prevUpperBand or heikinashi_close[1] > prevUpperBand ? upperBand : prevUpperBand
int direction = na
float superTrend = na
prevSuperTrend = superTrend[1]
if na(atr[1])
direction := 1
else if prevSuperTrend == prevUpperBand
direction := heikinashi_close > upperBand ? -1 : 1
else
direction := heikinashi_close < lowerBand ? 1 : -1
superTrend := direction == -1 ? lowerBand : upperBand
[superTrend, direction]
///////////////////////////////////////////////////
////////////////////Indicators/////////////////////
///////////////////////////////////////////////////
atrPeriod = input(10, "ATR Length")
factor = input.float(3.0, "Factor", step = 0.01)
[supertrend, direction] = x_supertrend(factor, atrPeriod)
bodyMiddle = plot((heikinashi_open + heikinashi_close) / 2, display=display.none)
upTrend = plot(direction < 0 ? supertrend : na, "Up Trend", color = color.green, style=plot.style_linebr)
downTrend = plot(direction < 0? na : supertrend, "Down Trend", color = color.red, style=plot.style_linebr)
fill(bodyMiddle, upTrend, color.new(color.green, 90), fillgaps=false)
fill(bodyMiddle, downTrend, color.new(color.red, 90), fillgaps=false)
///////////////////////////////////////////////////
////////////////////Strategy///////////////////////
///////////////////////////////////////////////////
var bool longCond = na, var bool shortCond = na, longCond := nz(longCond[1]), shortCond := nz(shortCond[1])
var int CondIni_long = 0, var int CondIni_short = 0, CondIni_long := nz(CondIni_long[1]), CondIni_short := nz(CondIni_short[1])
var float open_longCondition = na, var float open_shortCondition = na
long = ta.change(direction) < 0
short = ta.change(direction) > 0
longCond := long
shortCond := short
CondIni_long := longCond[1] ? 1 : shortCond[1] ? -1 : nz(CondIni_long[1])
CondIni_short := longCond[1] ? 1 : shortCond[1] ? -1 : nz(CondIni_short[1])
longCondition = (longCond[1] and nz(CondIni_long[1]) == -1)
shortCondition = (shortCond[1] and nz(CondIni_short[1]) == 1)
open_longCondition := long ? close[1] : nz(open_longCondition[1])
open_shortCondition := short ? close[1] : nz(open_shortCondition[1])
//TP
tp = input.float(1.1 , "TP [%]", step = 0.1)
//BACKTESTING inputs --------------------------------------------------------------------------------------------------------------------------------------------------------------------------------------------------------------------------------------------------------------------------------------------------------
testStartYear = input.int(2000, title="start year", minval = 1997, maxval = 3000, group= "BACKTEST")
testStartMonth = input.int(01, title="start month", minval = 1, maxval = 12, group= "BACKTEST")
testStartDay = input.int(01, title="start day", minval = 1, maxval = 31, group= "BACKTEST")
testPeriodStart = timestamp(testStartYear,testStartMonth,testStartDay,0,0)
testStopYear = input.int(3333, title="stop year", minval=1980, maxval = 3333, group= "BACKTEST")
testStopMonth = input.int(12, title="stop month", minval=1, maxval=12, group= "BACKTEST")
testStopDay = input.int(31, title="stop day", minval=1, maxval=31, group= "BACKTEST")
testPeriodStop = timestamp(testStopYear, testStopMonth, testStopDay, 0, 0)
testPeriod = true
// Backtest ==================================================================================================================================================================================================================================================================================================================================
if longCond
strategy.entry("L", strategy.long, when=testPeriod)
if shortCond
strategy.entry("S", strategy.short, when=testPeriod)
strategy.exit("TP_L", "L", profit =((open_longCondition * (1+(tp/100))) - open_longCondition)/syminfo.mintick)
strategy.exit("TP_S", "S", profit =((open_shortCondition * (1+(tp/100))) - open_shortCondition)/syminfo.mintick)