
Strategi trading TD reversal adalah strategi trading kuantitatif yang menggunakan indikator TD Sequential untuk mengidentifikasi sinyal reversal harga. Strategi ini didasarkan pada analisis dinamika harga, untuk membangun posisi over atau under setelah konfirmasi sinyal reversal harga.
Strategi ini menggunakan indikator TD Sequential untuk menganalisis fluktuasi harga dan mengidentifikasi bentuk reversal harga dari 9 garis K berturut-turut. Secara khusus, strategi ini menilai sebagai peluang shorting ketika mengidentifikasi garis K yang turun setelah kenaikan harga 9 garis K berturut-turut; sebaliknya, strategi ini menilai sebagai peluang lebih banyak ketika mengidentifikasi garis K yang naik setelah penurunan harga 9 garis K berturut-turut.
Menggunakan keuntungan dari indikator TD Sequential, sinyal reversal harga dapat ditangkap lebih awal. Dikombinasikan dengan sejumlah mekanisme penangkapan penurunan dalam strategi ini, posisi over atau short dapat dibuat tepat waktu setelah konfirmasi sinyal reversal, sehingga mendapatkan kesempatan masuk yang lebih baik pada tahap awal reversal harga.
Strategi perdagangan reversal TD momentum adalah strategi yang sangat cocok untuk digunakan oleh pedagang dengan momentum. Strategi ini memiliki keuntungan untuk mengidentifikasi peluang reversal, tetapi perlu berhati-hati untuk mengendalikan risiko dan menghindari kerugian yang lebih besar akibat false breakout. Dengan pengoptimalan lebih lanjut, ini adalah strategi perdagangan yang lebih seimbang antara risiko dan keuntungan.
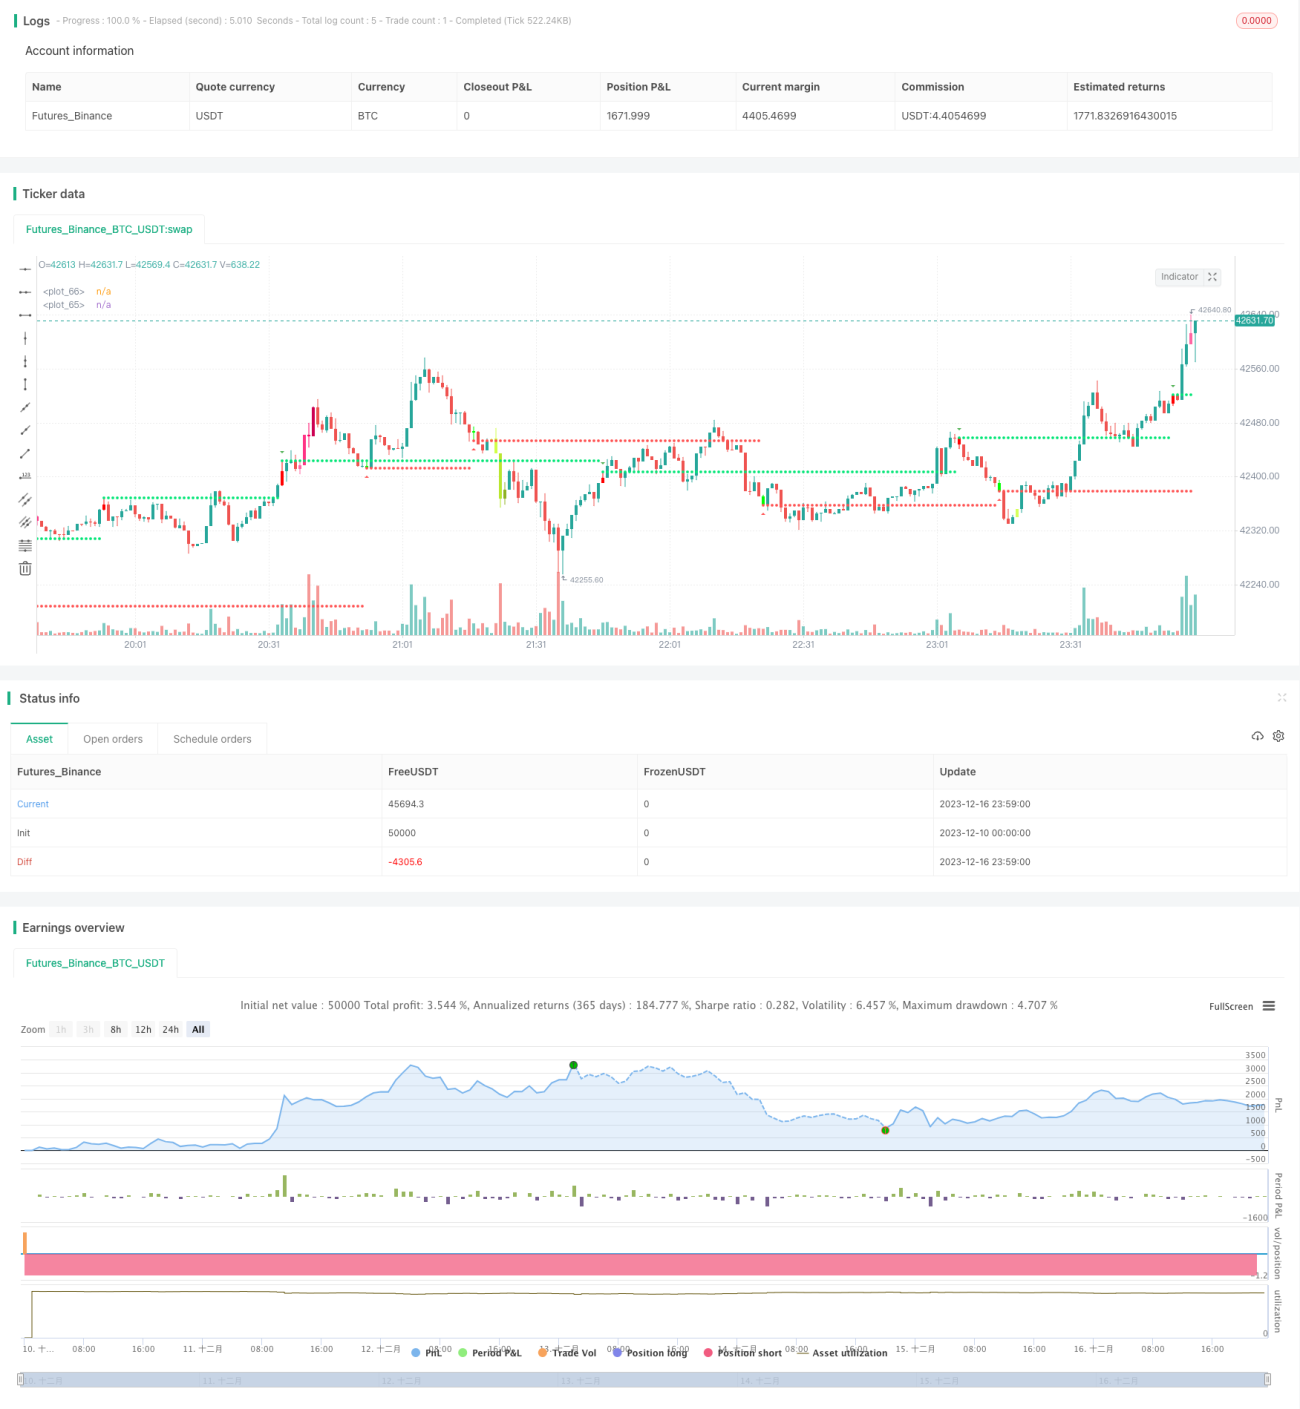
/*backtest
start: 2023-12-10 00:00:00
end: 2023-12-17 00:00:00
period: 1m
basePeriod: 1m
exchanges: [{"eid":"Futures_Binance","currency":"BTC_USDT"}]
*/
//@version=4
//This strategy is based on TD sequential study from glaz.
//I made some improvement and modification to comply with pine script version 4.
//Basically, it is a strategy based on proce action, supports and resistance.
strategy("Sequential Up/Down", overlay=true )
source = input(close)
BarsCount = input(9, "Count of consecutive bars")
useLinearRegression = input(false)
LR_length = input(13,"Linear Regression length")
SR = input(true,"Shows Supports and Resistance lines")
Barcolor = input(true,"Color bars when there is a signal")
transp = input(0, "Transparency of triangle Up or Downs")
Numbers = input(true,"Plot triangle Up or Downs at signal")
//Calculation
src=useLinearRegression?linreg(source,LR_length,0):source
UP = 0
DW = 0
UP := src > src[4] ? nz(UP[1]) + 1 : 0
DW := src < src[4] ? nz(DW[1]) + 1 : 0
UPUp = UP - valuewhen(UP < UP[1], UP, 1)
DWDn = DW - valuewhen(DW < DW[1], DW, 1)
plotshape(Numbers ? UPUp == BarsCount ? true : na : na, style=shape.triangledown, text="", color=color.green, location=location.abovebar, transp=transp)
plotshape(Numbers ? DWDn == BarsCount ? true : na : na, style=shape.triangleup, text="", color=color.red, location=location.belowbar, transp=transp)
// S/R Code By johan.gradin
//------------//
// Sell Setup //
//------------//
priceflip = barssince(src < src[4])
sellsetup = src > src[4] and priceflip
sell = sellsetup and barssince(priceflip != BarsCount)
sellovershoot = sellsetup and barssince(priceflip != BarsCount+4)
sellovershoot1 = sellsetup and barssince(priceflip != BarsCount+5)
sellovershoot2 = sellsetup and barssince(priceflip != BarsCount+6)
sellovershoot3 = sellsetup and barssince(priceflip != BarsCount+7)
//----------//
// Buy setup//
//----------//
priceflip1 = barssince(src > src[4])
buysetup = src < src[4] and priceflip1
buy = buysetup and barssince(priceflip1 != BarsCount)
buyovershoot = barssince(priceflip1 != BarsCount+4) and buysetup
buyovershoot1 = barssince(priceflip1 != BarsCount+5) and buysetup
buyovershoot2 = barssince(priceflip1 != BarsCount+6) and buysetup
buyovershoot3 = barssince(priceflip1 != BarsCount+7) and buysetup
//----------//
// TD lines //
//----------//
TDbuyh = valuewhen(buy, high, 0)
TDbuyl = valuewhen(buy, low, 0)
TDsellh = valuewhen(sell, high, 0)
TDselll = valuewhen(sell, low, 0)
//----------//
// Plots //
//----------//
plot(SR ? TDbuyh ? TDbuyl : na : na, style=plot.style_circles, linewidth=1, color=color.red)
plot(SR ? TDselll ? TDsellh : na : na, style=plot.style_circles, linewidth=1, color=color.lime)
barcolor(Barcolor ? sell ? #FF0000 : buy ? #00FF00 : sellovershoot ? #FF66A3 : sellovershoot1 ? #FF3385 : sellovershoot2 ? #FF0066 : sellovershoot3 ? #CC0052 : buyovershoot ? #D6FF5C : buyovershoot1 ? #D1FF47 : buyovershoot2 ? #B8E62E : buyovershoot3 ? #8FB224 : na : na)
// Strategy: (Thanks to JayRogers)
// === STRATEGY RELATED INPUTS ===
//tradeInvert = input(defval = false, title = "Invert Trade Direction?")
// the risk management inputs
inpTakeProfit = input(defval = 0, title = "Take Profit Points", minval = 0)
inpStopLoss = input(defval = 0, title = "Stop Loss Points", minval = 0)
inpTrailStop = input(defval = 100, title = "Trailing Stop Loss Points", minval = 0)
inpTrailOffset = input(defval = 0, title = "Trailing Stop Loss Offset Points", minval = 0)
// === RISK MANAGEMENT VALUE PREP ===
// if an input is less than 1, assuming not wanted so we assign 'na' value to disable it.
useTakeProfit = inpTakeProfit >= 1 ? inpTakeProfit : na
useStopLoss = inpStopLoss >= 1 ? inpStopLoss : na
useTrailStop = inpTrailStop >= 1 ? inpTrailStop : na
useTrailOffset = inpTrailOffset >= 1 ? inpTrailOffset : na
// === STRATEGY - LONG POSITION EXECUTION ===
enterLong() => buy or buyovershoot or buyovershoot1 or buyovershoot2 or buyovershoot3// functions can be used to wrap up and work out complex conditions
//exitLong() => oscillator <= 0
strategy.entry(id = "Buy", long = true, when = enterLong() )// use function or simple condition to decide when to get in
//strategy.close(id = "Buy", when = exitLong() )// ...and when to get out
// === STRATEGY - SHORT POSITION EXECUTION ===
enterShort() => sell or sellovershoot or sellovershoot2 or sellovershoot3
//exitShort() => oscillator >= 0
strategy.entry(id = "Sell", long = false, when = enterShort())
//strategy.close(id = "Sell", when = exitShort() )
// === STRATEGY RISK MANAGEMENT EXECUTION ===
// finally, make use of all the earlier values we got prepped
strategy.exit("Exit Buy", from_entry = "Buy", profit = useTakeProfit, loss = useStopLoss, trail_points = useTrailStop, trail_offset = useTrailOffset)
strategy.exit("Exit Sell", from_entry = "Sell", profit = useTakeProfit, loss = useStopLoss, trail_points = useTrailStop, trail_offset = useTrailOffset)