Strategi Peralihan RSI Cepat Noro v1.7
Ringkasan
Noro’s Quick RSI Switching Strategy adalah strategi perdagangan kuantitatif yang menggunakan indikator RSI untuk mengidentifikasi peluang overbought dan oversold. Strategi ini menggabungkan bentuk K-line, penyaringan linear, dan metode stop loss untuk mengendalikan risiko.
Strategi ini didasarkan pada beberapa komponen utama:
- Indikator RSI cepat: digunakan untuk mengidentifikasi peluang overbought dan oversold
- Bentuk garis K: kombinasi antara entitas garis K dan garis yin dan yang, membantu menilai tren
- Filter rata-rata: menggunakan filter rata-rata SMA untuk menghindari sinyal palsu
- Mekanisme Stop Loss: Terkait dengan zona batas RSI, capai Stop Loss
Prinsip Strategi
Strategi Noro untuk mengubah RSI dengan cepat didasarkan pada beberapa sinyal jual beli berikut:
Sinyal overbought/oversold RSI cepat: Sinyal perdagangan dihasilkan ketika RSI cepat melewati batas atasnya atau batas bawahnya.
Sinyal bentuk K-line: menggabungkan ukuran entitas K-line, arah sinar matahari dan lain-lain, untuk menilai tren, membantu menghasilkan sinyal RSI cepat.
Sinyal penyaringan garis rata: menggabungkan arah garis rata SMA, menghindari terjadinya false breakout.
Sinyal stop loss: Stop loss terjadi ketika RSI cepat kembali melewati batas atas atau bawahnya.
Secara khusus, strategi ini didasarkan pada rasio overbought dan oversold pada RSI cepat untuk menilai peluang perdagangan. Ketika RSI cepat melewati batas bawahnya, ini dianggap sebagai sinyal oversold; Ketika RSI cepat melewati batas atasnya, ini dianggap sebagai sinyal overbought.
Untuk menghindari kebisingan, strategi ini menambahkan penilaian tambahan sebagai berikut:
- Ukuran entitas K-line: semakin besar entitas K-line, semakin jelas tren
- Garis Sian-Yang: Menentukan arah tren K-Line
- SMA rata-rata: memfilter sinyal palsu
- Stop loss: Stop loss saat RSI cepat kembali melewati zona terbatas
Jadi, strategi ini menggabungkan RSI yang cepat, K-line form, median dan stop loss untuk membuat keputusan perdagangan.
Keunggulan Strategis
Strategi ini memiliki beberapa keuntungan:
- RSI Rapid Sensitivity High: Dapat menangkap peluang overbought dan oversold dengan cepat
- K-Line dan Kesamaan: Hindari Perdagangan Noise
- Stop loss otomatis: Anda dapat menghentikan kerugian tepat waktu dan mengontrol risiko
- Cocok untuk transaksi short line: Cocok untuk periode short line seperti 1 jam, 30 menit, dll.
- Mudah dioptimalkan: parameter dapat disesuaikan dengan pasar yang berbeda
Risiko Strategis
Strategi ini juga memiliki beberapa risiko:
- Kemungkinan terjadinya stop loss berturut-turut: Pada saat terjadi getaran, sinyal stop loss akan muncul lebih banyak
- Parameter yang perlu dioptimalkan: Parameter yang perlu disesuaikan dengan siklus dan varietas yang berbeda
- Tidak dapat sepenuhnya menghindari kerugian: penghentian tepat waktu juga dapat menyebabkan kerugian
Untuk mengurangi risiko, ada beberapa cara untuk mengoptimalkan:
- Optimalkan parameter RSI cepat untuk mengurangi noise trading
- Optimalkan posisi stop loss, kendalikan kerugian tunggal
- Menambahkan Modul Manajemen Uang, Dispersifikasi Risiko
Arah optimasi strategi
Strategi ini dapat dioptimalkan dalam beberapa hal:
- Strategi stop loss tambahan: Stop loss setelah keuntungan mencapai tingkat tertentu, mengunci sebagian keuntungan
- Meningkatkan pengelolaan dana: Menambahkan kontrol posisi, penyebaran risiko, dan lain-lain
- Optimalisasi parameter untuk periode yang berbeda: menyesuaikan parameter indikator untuk menguji efek dari periode yang berbeda
- Meningkatkan pembelajaran mesin: Menggunakan algoritma untuk mengoptimalkan parameter secara otomatis dan beradaptasi dengan perubahan pasar
- Pengujian varietas: menguji strategi kebugaran pada lebih banyak varietas
Strategi ini dapat meningkatkan stabilitas strategi secara signifikan dengan meningkatkan strategi ini melalui pencegahan, manajemen risiko, optimasi parameter, dan pembelajaran mesin.
Meringkaskan
Secara keseluruhan, strategi pertukaran RSI cepat Noro menggabungkan indikator RSI cepat dengan indikator teknis K-line yang membantu untuk mencapai strategi perdagangan garis pendek untuk menilai overbought dan oversold. Strategi ini merespons dengan cepat dan mudah dioptimalkan, sambil menambahkan modul stop loss untuk mengendalikan risiko. Dengan pembelajaran mesin lebih lanjut dan pengoptimalan parameter, ada harapan untuk mendapatkan efek strategi yang lebih baik.
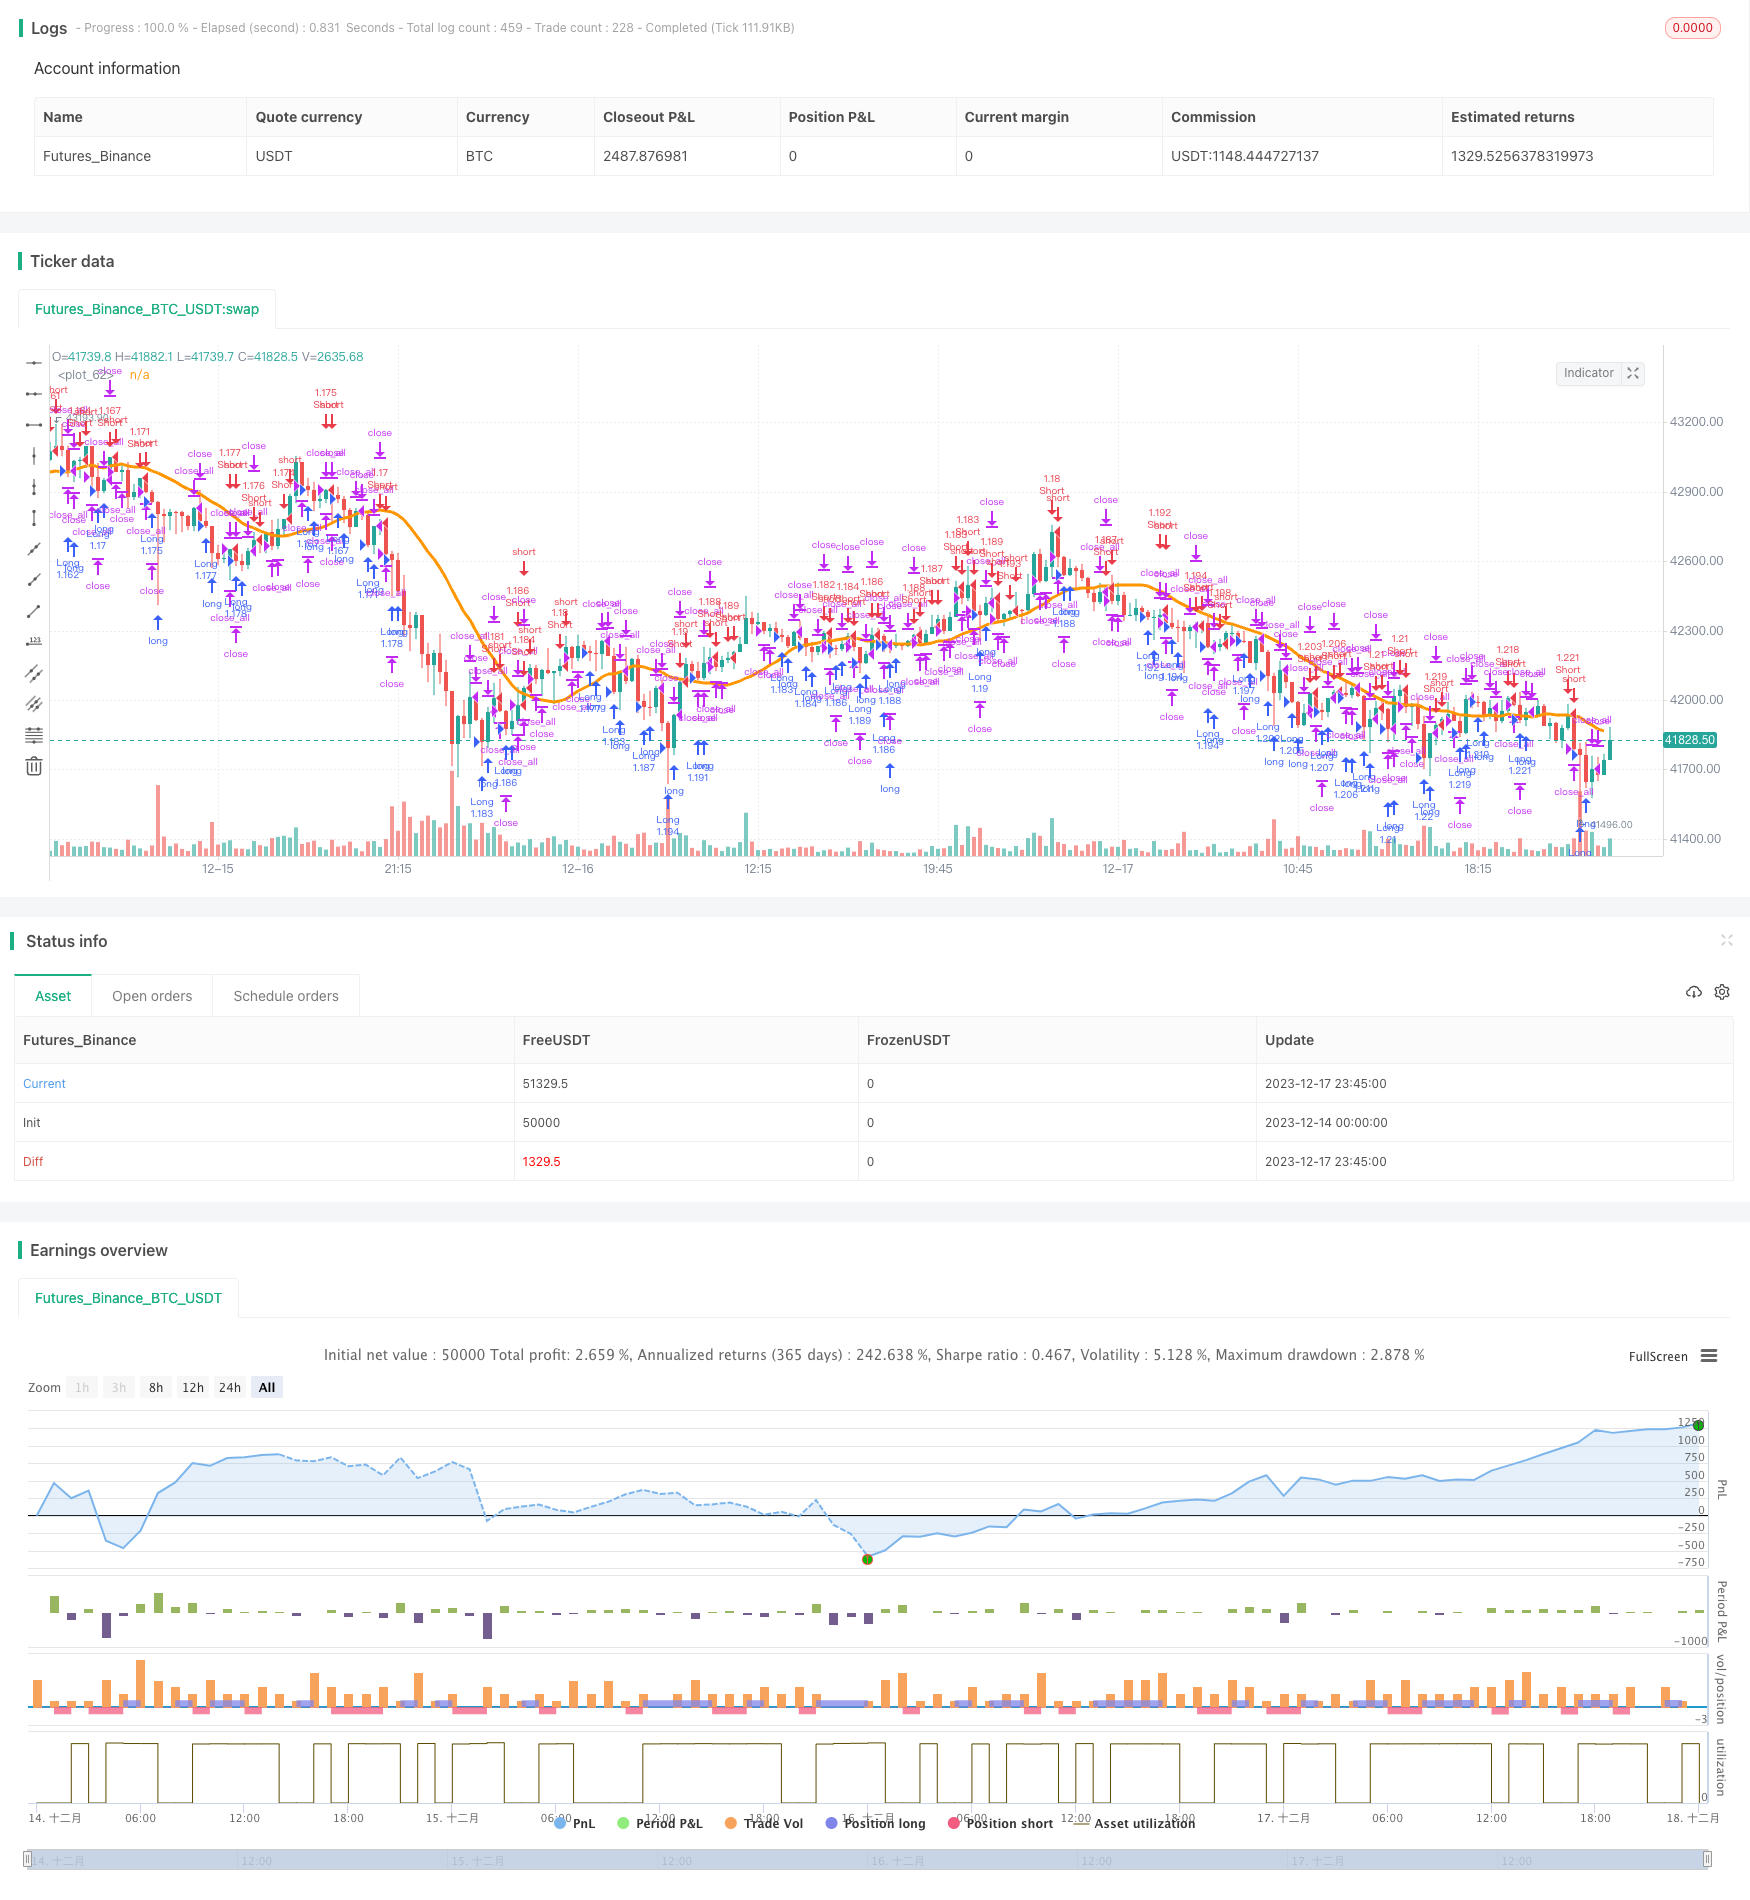
/*backtest
start: 2023-12-14 00:00:00
end: 2023-12-18 00:00:00
period: 15m
basePeriod: 5m
exchanges: [{"eid":"Futures_Binance","currency":"BTC_USDT"}]
*/

//Noro
//2018

//@version=2
strategy(title = "Noro's Fast RSI Strategy v1.7", shorttitle = "Fast RSI str 1.7", overlay = true)

//Settings
needlong = input(true, defval = true, title = "Long")
needshort = input(true, defval = true, title = "Short")
usemar = input(false, defval = false, title = "Use Martingale")
capital = input(100, defval = 100, minval = 1, maxval = 10000, title = "Capital, %")
usersi = input(true, defval = true, title = "Use Fast RSI Strategy")
usemm = input(true, defval = true, title = "Use Min/Max Strategy")
usebc = input(true, defval = true, title = "Use BarColor Strategy")
usesma = input(false, defval = false, title = "Use SMA Filter")
smaperiod = input(20, defval = 20, minval = 2, maxval = 1000, title = "SMA Filter Period")
fast = input(7, defval = 7, minval = 2, maxval = 50, title = "Fast RSI Period")
limit = input(30, defval = 30, minval = 1, maxval = 100, title = "RSI limit")
rsisrc = input(close, defval = close, title = "RSI Price")
rsibars = input(1, defval = 1, minval = 1, maxval = 20, title = "RSI Bars")
mmbars = input(1, defval = 1, minval = 1, maxval = 5, title = "Min/Max Bars")
showsma = input(false, defval = false, title = "Show SMA Filter")
showarr = input(false, defval = false, title = "Show Arrows")
fromyear = input(2018, defval = 2018, minval = 1900, maxval = 2100, title = "From Year")
toyear = input(2100, defval = 2100, minval = 1900, maxval = 2100, title = "To Year")
frommonth = input(01, defval = 01, minval = 01, maxval = 12, title = "From Month")
tomonth = input(12, defval = 12, minval = 01, maxval = 12, title = "To Month")
fromday = input(01, defval = 01, minval = 01, maxval = 31, title = "From day")
today = input(31, defval = 31, minval = 01, maxval = 31, title = "To day")

//Fast RSI
fastup = rma(max(change(rsisrc), 0), fast)
fastdown = rma(-min(change(rsisrc), 0), fast)
fastrsi = fastdown == 0 ? 100 : fastup == 0 ? 0 : 100 - (100 / (1 + fastup / fastdown))

//Limits
bar = close > open ? 1 : close < open ? -1 : 0
uplimit = 100 - limit
dnlimit = limit

//RSI Bars
upsignal = fastrsi > uplimit ? 1 : 0
dnsignal = fastrsi < dnlimit ? 1 : 0
uprsi = sma(upsignal, rsibars) == 1
dnrsi = sma(dnsignal, rsibars) == 1

//Body
body = abs(close - open)
abody = sma(body, 10)

//MinMax Bars
min = min(close, open)
max = max(close, open)
minsignal = min < min[1] and bar == -1 and bar[1] == -1 ? 1 : 0
maxsignal = max > max[1] and bar == 1 and bar[1] == 1 ? 1 : 0
mins = sma(minsignal, mmbars) == 1
maxs = sma(maxsignal, mmbars) == 1

//SMA Filter
sma = sma(close, smaperiod)
colorsma = showsma ? blue : na
plot(sma, color = colorsma, linewidth = 3)

//Signals
up1 = bar == -1 and (strategy.position_size == 0 or close < strategy.position_avg_price) and dnrsi and body > abody / 5 and usersi
dn1 = bar == 1 and (strategy.position_size == 0 or close > strategy.position_avg_price) and uprsi and body > abody / 5 and usersi
up2 = mins and (close > sma or usesma == false) and fastrsi < 70 and usemm
dn2 = maxs and (close < sma or usesma == false) and fastrsi > 30 and usemm
up3 = sma(bar, 2) == -1 and usebc
dn3 = sma(bar, 2) == 1 and usebc
exit = (((strategy.position_size > 0 and fastrsi > dnlimit and bar == 1) or (strategy.position_size < 0 and fastrsi < uplimit and bar == -1)) and body > abody / 2)

//Arrows
col = exit ? black : up1 or dn1 ? blue : up2 or dn2 ? red : na
needup = up1 or up2
needdn = dn1 or dn2
needexitup = exit and strategy.position_size < 0
needexitdn = exit and strategy.position_size > 0
plotarrow(showarr and needup ? 1 : na, colorup = blue, colordown = blue, transp = 0)
plotarrow(showarr and needdn ? -1 : na, colorup = blue, colordown = blue, transp = 0)
plotarrow(showarr and needexitup ? 1 : na, colorup = black, colordown = black, transp = 0)
plotarrow(showarr and needexitdn ? -1 : na, colorup = black, colordown = black, transp = 0)

//Trading
profit = exit ? ((strategy.position_size > 0 and close > strategy.position_avg_price) or (strategy.position_size < 0 and close < strategy.position_avg_price)) ? 1 : -1 : profit[1]
mult = usemar ? exit ? profit == -1 ? mult[1] * 2 : 1 : mult[1] : 1
lot = strategy.position_size == 0 ? strategy.equity / close * capital / 100 * mult : lot[1]

if up1 or up2 or up3
    if strategy.position_size < 0
        strategy.close_all()

    strategy.entry("Long", strategy.long, needlong == false ? 0 : lot)

if dn1 or dn2 or dn3
    if strategy.position_size > 0
        strategy.close_all()

    strategy.entry("Short", strategy.short, needshort == false ? 0 : lot)

if time > timestamp(toyear, tomonth, today, 23, 59) or exit
    strategy.close_all()