Strategi Perdagangan Rata-rata Pergerakan Heinach Berdasarkan Persentil
Ringkasan
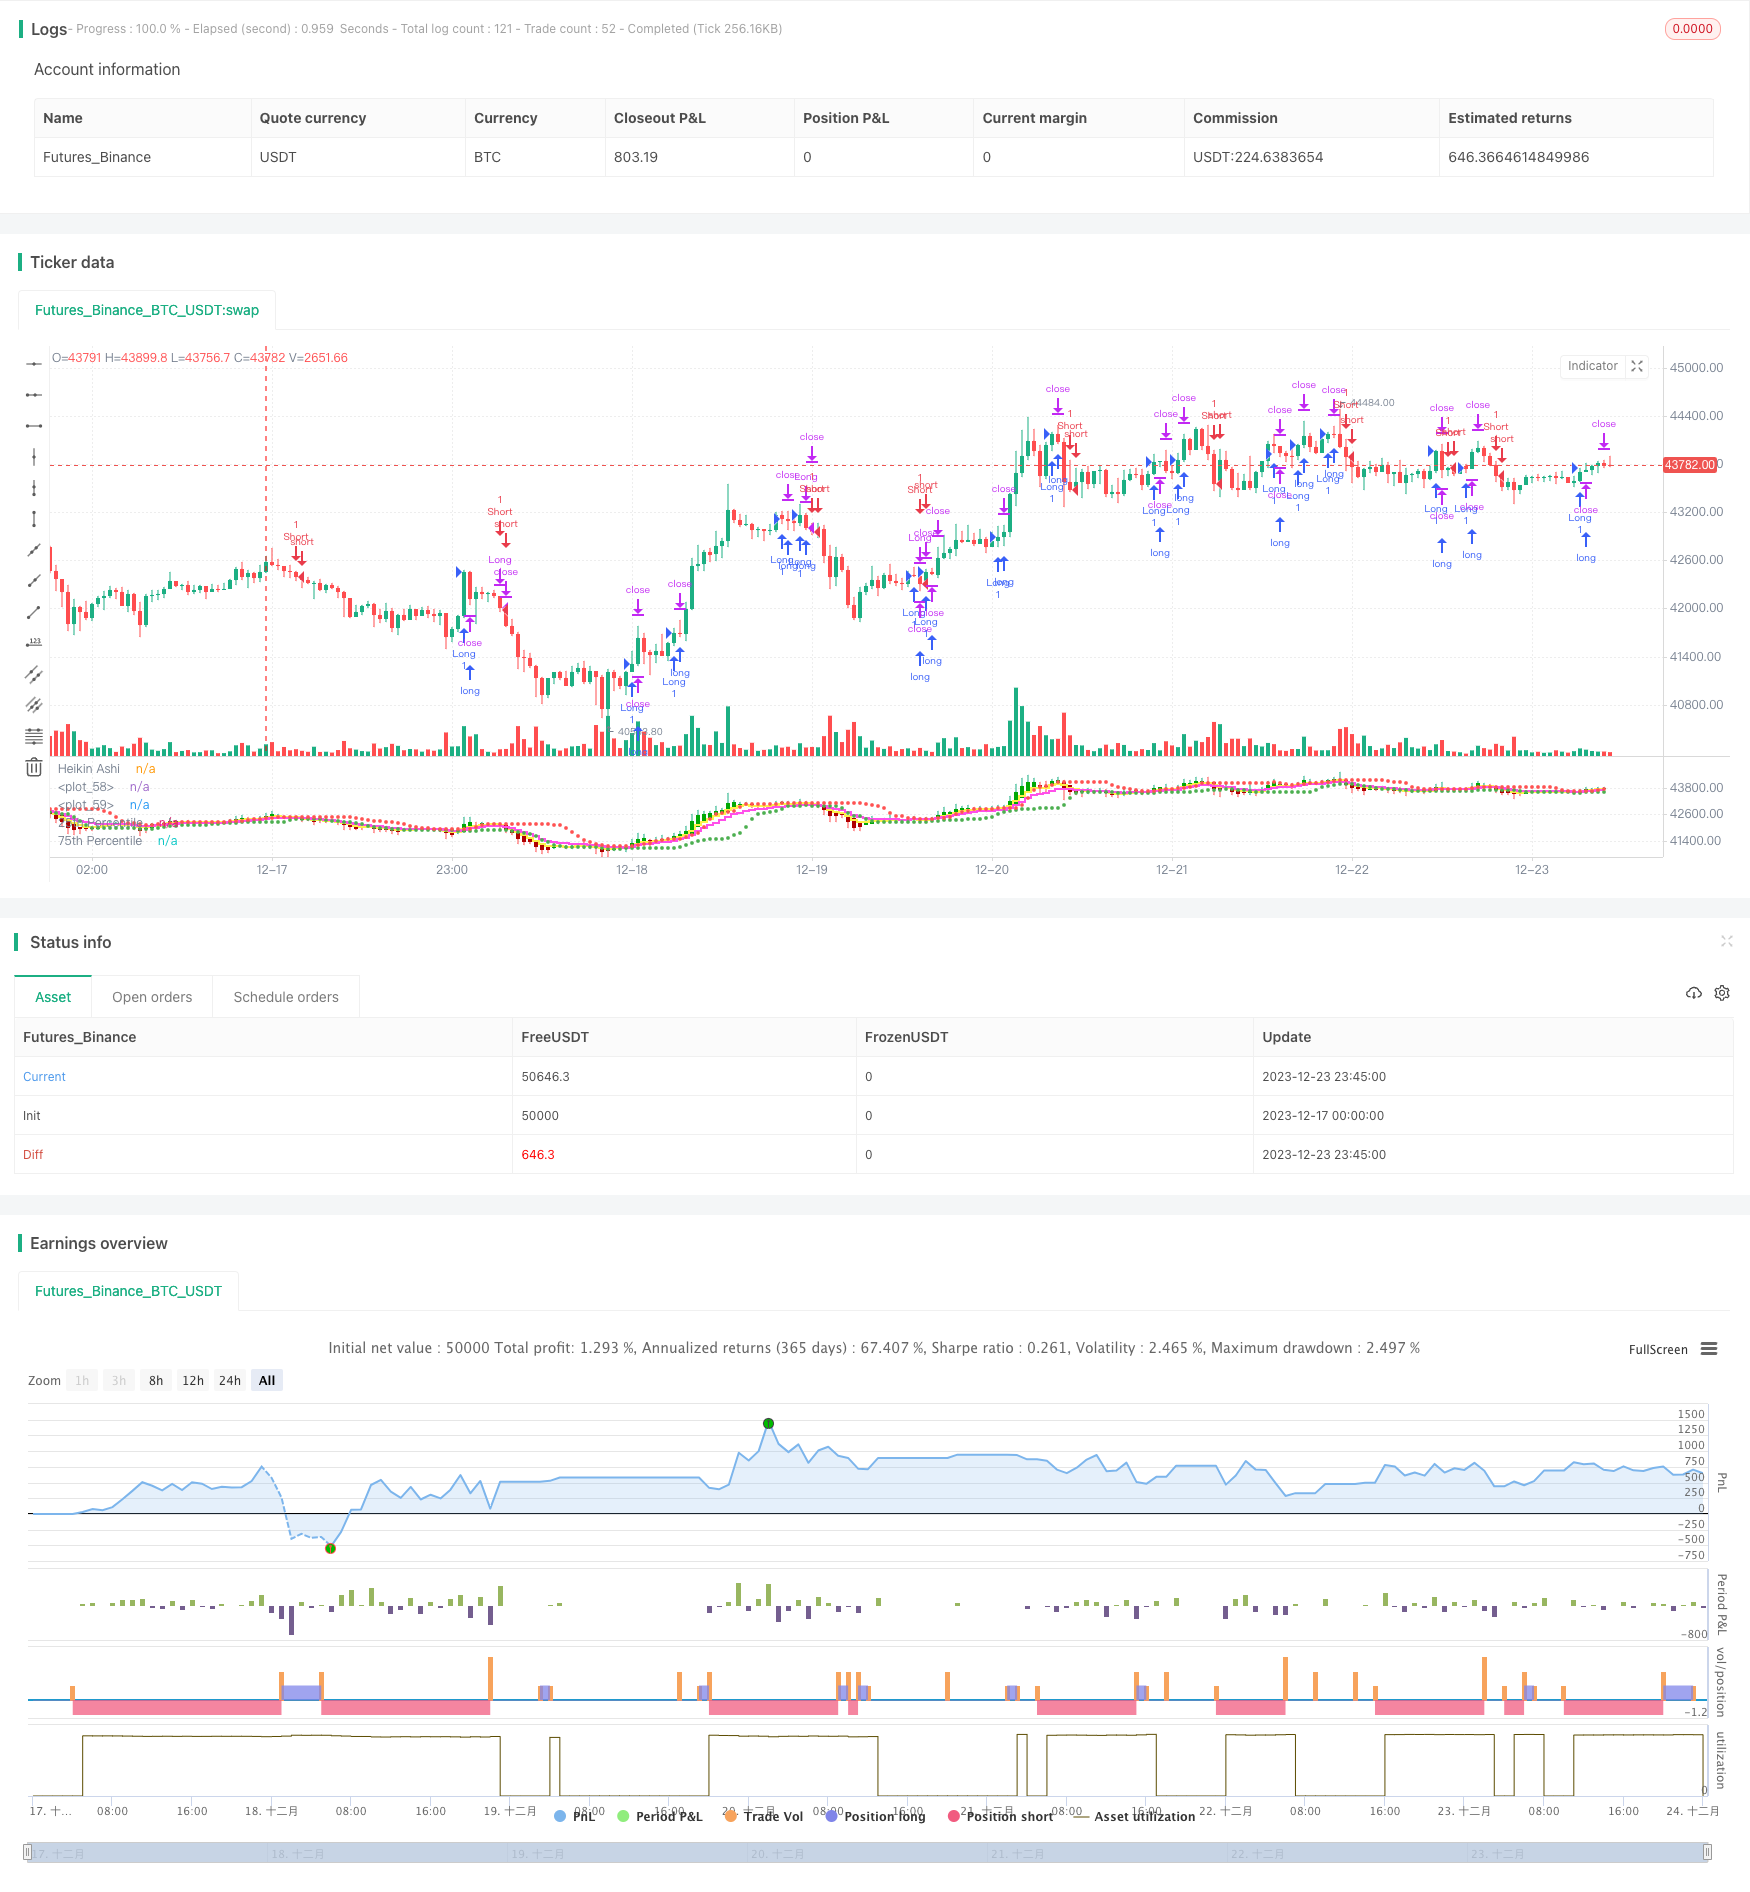
Strategi ini didasarkan pada pembuatan sinyal perdagangan pada garis rata-rata Heinrich. Di dalamnya, pembuatan sinyal beli dan jual mempertimbangkan dua faktor: persilangan harga tutup Heinrich dengan tingkat harga 75 persen dan harga tutup Heinrich di atas rata-rata bergerak.
Prinsip Strategi
Strategi ini digunakan untuk analisis dengan menggunakan garis rata-rata Heinrich Asch sebagai pengganti garis K biasa, yang memfilter kebisingan pasar dan lebih baik untuk menemukan tren dan sinyal reversal. Secara khusus, strategi ini menggabungkan saluran persentase dan rata-rata bergerak untuk menghasilkan sinyal perdagangan:
- Ini adalah sinyal beli yang dihasilkan ketika harga Hyndai mencapai titik 75 persen di titik akhir.
- Sinyal jual muncul saat Hyndai melewati Moving Average 5 Hari di bawah harga close out.
Selain itu, strategi ini juga menetapkan jarak stop loss dan pelacakan stop loss untuk mengendalikan risiko unilateral.
Keunggulan Strategis
- Garis rata-rata Heinrich dapat digunakan untuk mengidentifikasi tren dengan lebih jelas dan untuk menemukan sinyal pembalikan tepat waktu.
- Dengan menggunakan saluran persentase, dapat ditentukan apakah harga berada di posisi overbought atau oversold, untuk menentukan kapan harus membeli dan menjual.
- Pengaturan stop loss dan pelacakan stop loss membantu untuk mengontrol risiko secara aktif dan menghindari kerugian di luar yang dapat ditanggung.
Risiko Strategis
- Garis rata-rata Heinrichs sendiri akan mengalami lag dan mungkin akan melewatkan titik-titik terbaik untuk operasi garis pendek.
- Saluran persentase tidak dapat sepenuhnya menentukan titik balik harga, ada tingkat sinyal palsu tertentu.
- Stop loss distance yang tidak tepat dapat terlalu longgar atau terlalu ketat, sehingga mempengaruhi kinerja strategi.
Untuk mengurangi risiko di atas, Anda dapat menyesuaikan siklus moving average atau menyesuaikan stop loss ratio.
Optimasi Strategi
- Uji kombinasi rata-rata bergerak yang berbeda untuk menemukan parameter terbaik.
- Ujilah parameter saluran persentase yang berbeda untuk memastikan bahwa harga menangkap zona panas.
- Ini adalah indikator yang digunakan untuk memverifikasi sinyal jual beli dan memfilter sinyal palsu.
- Dinamiskan jarak stop loss.
Meringkaskan
Strategi ini mengintegrasikan beberapa indikator seperti garis rata-rata Heinrich, saluran persentase, dan rata-rata bergerak untuk membentuk sistem perdagangan. Sistem ini dapat secara efektif mengidentifikasi arah tren, dan mengatur stop loss untuk mengendalikan risiko, merupakan strategi perdagangan kuantitatif yang patut dipertimbangkan. Dengan mengoptimalkan parameter dan menambahkan indikator bantu lainnya, diharapkan untuk meningkatkan stabilitas sistem lebih lanjut.
/*backtest
start: 2023-12-17 00:00:00
end: 2023-12-24 00:00:00
period: 45m
basePeriod: 5m
exchanges: [{"eid":"Futures_Binance","currency":"BTC_USDT"}]
*/

//@version=5
strategy("HK Percentile Interpolation One",shorttitle = "HKPIO", overlay=false, default_qty_type = strategy.cash, default_qty_value = 5000, calc_on_order_fills = true, calc_on_every_tick = true)

// Input parameters
stopLossPercentage = input(3, title="Stop Loss (%)") // User can set Stop Loss as a percentage
trailStopPercentage = input(1.5, title="Trailing Stop (%)") // User can set Trailing Stop as a percentage
lookback = input.int(14, title="Lookback Period", minval=1) // User can set the lookback period for percentile calculation
yellowLine_length = input.int(5, "Yellow", minval=1) // User can set the length for Yellow EMA
purplLine_length = input.int(10, "Purple", minval=1) // User can set the length for Purple EMA
holdPeriod = input.int(200, title="Minimum Holding Period", minval=10) // User can set the minimum holding period
startDate = timestamp("2021 01 01")  // User can set the start date for the strategy

// Calculate Heikin Ashi values
haClose = ohlc4
var float haOpen = na
haOpen := na(haOpen[1]) ? (open + close) / 2 : (haOpen[1] + haClose[1]) / 2
haHigh = math.max(nz(haOpen, high), nz(haClose, high), high)
haLow = math.min(nz(haOpen, low), nz(haClose, low), low)

// Calculate Moving Averages
yellowLine = ta.ema(haClose, yellowLine_length)
purplLine = ta.ema(haClose, purplLine_length)

// Calculate 25th and 75th percentiles
p25 = ta.percentile_linear_interpolation(haClose, lookback, 28)
p75 = ta.percentile_linear_interpolation(haClose, lookback, 78)

// Generate buy/sell signals
longSignal = ta.crossover(haClose, p75) and haClose > yellowLine
sellSignal = ta.crossunder(haClose, yellowLine)
longSignal1 = ta.crossover(haClose, p75) and haClose > purplLine
sellSignal1 = ta.crossunder(haClose, purplLine)

// Set start time and trade conditions
if(time >= startDate)
    // When longSignal is true, enter a long trade and set stop loss and trailing stop conditions
    if (longSignal)
        strategy.entry("Long", strategy.long, 1)
        strategy.exit("Sell", "Long", stop=close*(1-stopLossPercentage/100), trail_points=close*trailStopPercentage/100, trail_offset=close*trailStopPercentage/100)
    // When sellSignal is true, close the long trade
    if (sellSignal)
        strategy.close("Long")
    // When sellSignal1 is true, enter a short trade
    if (sellSignal1)
        strategy.entry("Short", strategy.short, 1)
    // When longSignal1 is true, close the short trade
    if (longSignal1)
        strategy.close("Short")

// Plot Heikin Ashi candles
plotcandle(haOpen, haHigh, haLow, haClose, title="Heikin Ashi", color=(haClose >= haOpen ? color.rgb(1, 168, 6) : color.rgb(176, 0, 0)))

// Plot 25th and 75th percentile levels
plot(p25, title="25th Percentile", color=color.green, linewidth=1, style=plot.style_circles)
plot(p75, title="75th Percentile", color=color.red, linewidth=1, style=plot.style_circles)

// Plot Moving Averages
plot(yellowLine, color = color.rgb(254, 242, 73, 2), linewidth = 2, style = plot.style_stepline)
plot(purplLine, color = color.rgb(255, 77, 234, 2), linewidth = 2, style = plot.style_stepline)