Strategi Perdagangan Bollinger Band Downward Crossover RSI Pullback
Ringkasan
Strategi ini menggunakan indikator Bollinger Bands untuk menentukan apakah harga memasuki zona overbought dan oversold, dikombinasikan dengan indikator RSI untuk menentukan apakah ada peluang untuk membalikkan posisi, melakukan shorting ketika zona overbought terbentuk, dan stop loss ketika harga naik melampaui Bollinger Bands.
Prinsip Strategi
Strategi ini didasarkan pada prinsip-prinsip berikut:
- Ketika harga penutupan di atas melintasi Bollinger Bands, menunjukkan bahwa aset telah memasuki zona overbought dan ada peluang untuk melakukan pullback.
- Indeks RSI dapat digunakan untuk mengidentifikasi zona overbought dan oversold. RSI>70 adalah zona overbought.
- Ketika harga penutupan turun dari atas ke bawah, ambil posisi terbuka
- Ketika RSI memicu penurunan dari zona overbought atau stop loss, stop loss akan dihapus.
Analisis Keunggulan
Strategi ini memiliki keuntungan sebagai berikut:
- Menggunakan Brinks untuk menentukan area overbought dan oversold untuk meningkatkan tingkat keberhasilan perdagangan
- Menghindari kerugian yang tidak perlu dengan menggunakan RSI untuk memfilter peluang terobosan palsu.
- Rasio untung rugi tinggi, pengendalian risiko maksimal
Analisis risiko
Strategi ini memiliki risiko sebagai berikut:
- Pertumbuhan terus berlanjut setelah terjatuh ke jalur yang menyebabkan kerugian semakin meluas.
- RSI gagal kembali pada waktu yang tepat, kerugian terus berkembang
- Posisi unilateral, tidak dapat melakukan transaksi di pasar.
Risiko dapat dikurangi dengan melakukan hal berikut:
- Adaptasi Stop Loss yang Tepat, Stop Loss yang Tepat
- Kombinasi Indikator lain untuk menilai sinyal RSI mundur
- Tergabung dengan indikator rata-rata, untuk menentukan apakah masuk ke penyusunan
Arah optimasi
Strategi ini dapat dioptimalkan dengan:
- Optimalkan parameter Brin Belt untuk lebih banyak varietas perdagangan
- Optimalkan parameter RSI untuk meningkatkan efektivitas indikator
- Menambahkan kombinasi indikator lain untuk menentukan titik balik tren
- Menambahkan logika transaksi multihead
- Tergabung dengan strategi stop loss, secara dinamis menyesuaikan titik stop loss
Meringkaskan
Strategi ini secara keseluruhan adalah strategi perdagangan cepat pendek zona overbought yang khas. Menggunakan Bollinger Bands untuk menentukan titik jual beli, sinyal RSI filter. Mengontrol tingkat risiko dengan menghentikan kerugian yang masuk akal.
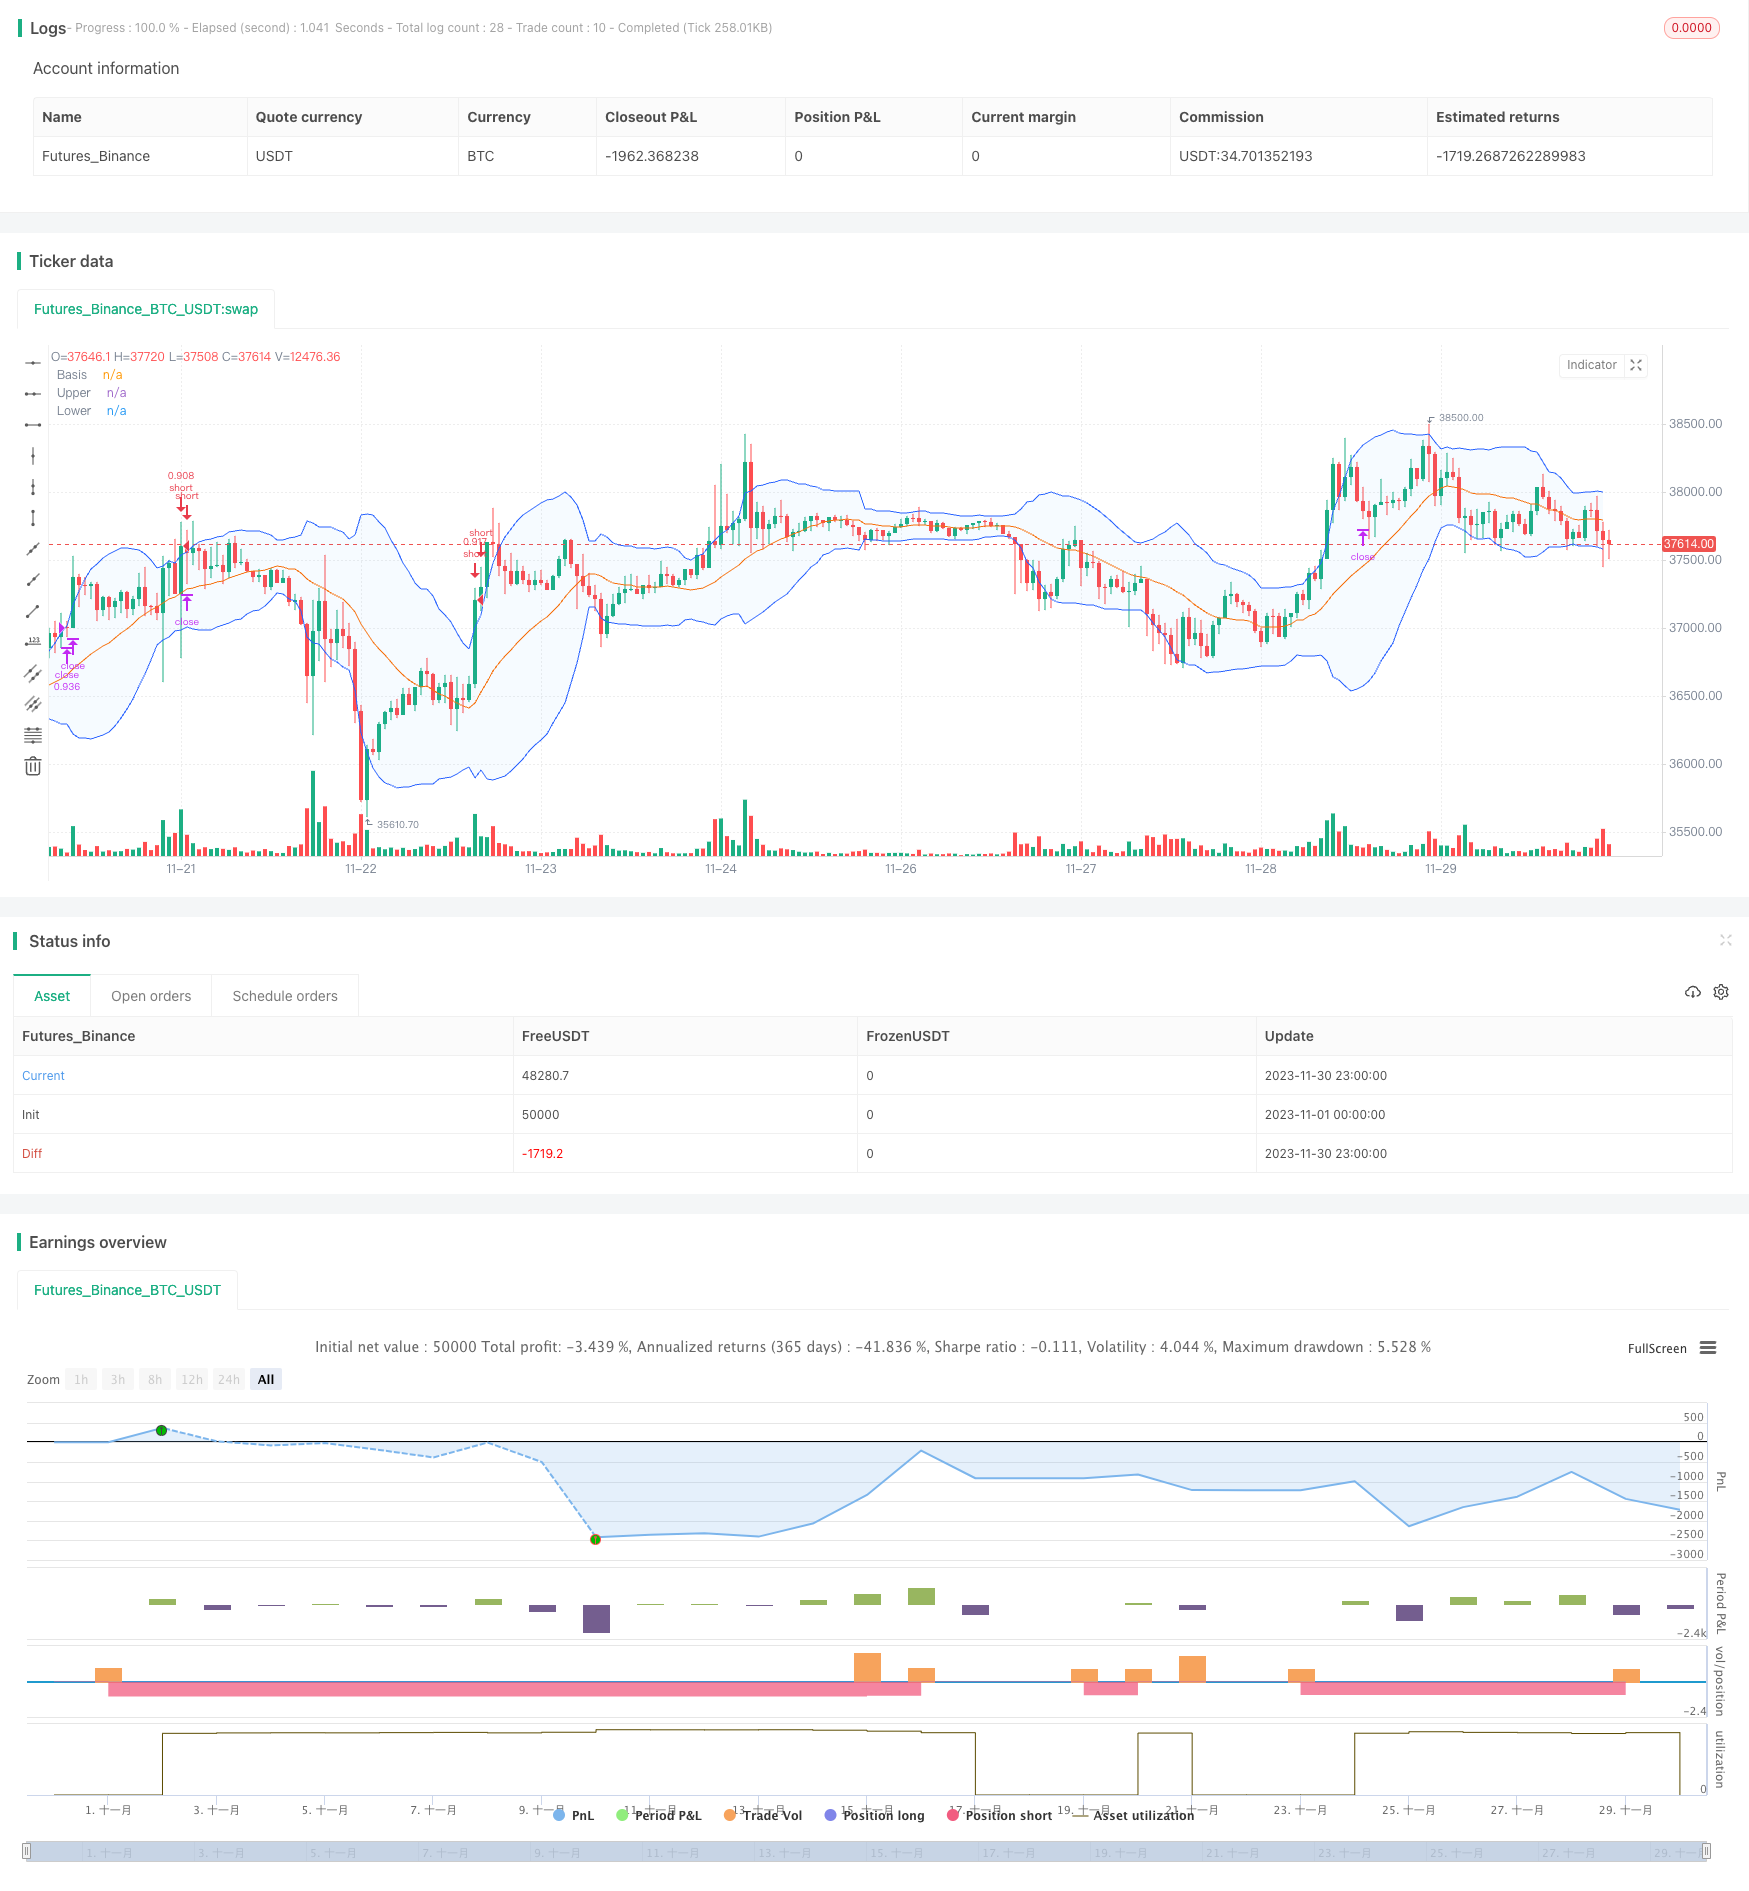
/*backtest
start: 2023-11-01 00:00:00
end: 2023-11-30 23:59:59
period: 1h
basePeriod: 15m
exchanges: [{"eid":"Futures_Binance","currency":"BTC_USDT"}]
*/

//@version=5
// This source code is subject to the terms of the Mozilla Public License 2.0 at https://mozilla.org/MPL/2.0/
// © Coinrule


strategy("Bollinger Band Below Price with RSI",
         overlay=true,
         initial_capital=1000,
         process_orders_on_close=true,
         default_qty_type=strategy.percent_of_equity,
         default_qty_value=70,
         commission_type=strategy.commission.percent,
         commission_value=0.1)

showDate = input(defval=true, title='Show Date Range')
timePeriod = time >= timestamp(syminfo.timezone, 2022, 1, 1, 0, 0)
notInTrade = strategy.position_size <= 0

//Bollinger Bands Indicator
length = input.int(20, minval=1)
src = input(close, title="Source")
mult = input.float(2.0, minval=0.001, maxval=50, title="StdDev")
basis = ta.sma(src, length)
dev = mult * ta.stdev(src, length)
upper = basis + dev
lower = basis - dev
offset = input.int(0, "Offset", minval = -500, maxval = 500)
plot(basis, "Basis", color=#FF6D00, offset = offset)
p1 = plot(upper, "Upper", color=#2962FF, offset = offset)
p2 = plot(lower, "Lower", color=#2962FF, offset = offset)
fill(p1, p2, title = "Background", color=color.rgb(33, 150, 243, 95))

// RSI inputs and calculations
lengthRSI = 14
RSI = ta.rsi(close, lengthRSI)


// Configure trail stop level with input options
longTrailPerc = input.float(title='Trail Long Loss (%)', minval=0.0, step=0.1, defval=3) * 0.01
shortTrailPerc = input.float(title='Trail Short Loss (%)', minval=0.0, step=0.1, defval=3) * 0.01

// Determine trail stop loss prices
//longStopPrice = 0.0
shortStopPrice = 0.0

//longStopPrice := if strategy.position_size > 0
    //stopValue = close * (1 - longTrailPerc)
    //math.max(stopValue, longStopPrice[1])
//else
    //0

shortStopPrice := if strategy.position_size < 0
    stopValue = close * (1 + shortTrailPerc)
    math.min(stopValue, shortStopPrice[1])
else
    999999


//Entry and Exit
strategy.entry(id="short", direction=strategy.short, when=ta.crossover(close, upper) and RSI < 70 and timePeriod and notInTrade)

if (ta.crossover(upper, close) and RSI > 70 and timePeriod)
    strategy.exit(id='close', limit = shortStopPrice)