Strategi Backtesting Osilator Pelangi
Ringkasan
Strategi Rainbow Oscillator Retracement adalah strategi perdagangan kuantitatif yang didasarkan pada indikator Rainbow Oscillator. Strategi ini menilai arah dan kekuatan tren pasar dengan menghitung seberapa jauh harga saham dari garis rata-rata, untuk menentukan arah posisi panjang dan pendek.
Prinsip Strategi
Indikator inti dari strategi ini adalah Rainbow Oscillator (RO), yang dihitung dengan rumus sebagai berikut:
RO = 100 * ((收盘价 - 10日移动平均线) / (最高价的最高值 - 最低价的最低值))
Moving average 10 hari adalah moving average sederhana dari harga penutupan 10 periode. Indikator ini mencerminkan penyimpangan harga dari garis rata-rata sendiri. Ketika RO > 0, berarti harga di atas garis rata-rata, sebagai sinyal bullish; Ketika RO < 0, berarti harga di bawah garis rata-rata, sebagai sinyal bearish.
Strategi ini juga menghitung indikator tambahan untuk bandwidth, Bandwidth, RB, dengan rumus sebagai berikut:
RB = 100 * ((均线的最高值 - 均线的最低值) / (最高价的最高值 - 最低价的最低值))
RB mencerminkan lebar antara garis rata-rata. Semakin besar RB, semakin besar fluktuasi harga, sebaliknya harga stabil. Indikator RB dapat digunakan untuk menilai tingkat stabilitas pasar.
Berdasarkan nilai indikator RO dan RB, strategi ini menilai tingkat penyimpangan harga dan stabilitas pasar, sehingga menghasilkan sinyal perdagangan untuk posisi panjang dan pendek.
Keunggulan Strategis
Strategi ini memiliki keuntungan sebagai berikut:
- Berdasarkan penilaian dua indikator, menghindari keterbatasan penilaian satu indikator.
- Hal ini dapat dilihat dari pergerakan harga dan stabilitas pasar.
- Perhitungan sederhana, mudah dipahami dan diterapkan.
- Indikator visualisasi, membentuk efek pelangi, intuitif dan mudah dibaca.
Risiko Strategis
Strategi ini juga memiliki beberapa risiko:
- Setting parameter indikator RO dan RB yang tidak tepat dapat menyebabkan kesalahan sinyal perdagangan.
- Strategi biner ini mudah menghasilkan sinyal yang salah dan sering terjadi transaksi.
- Siklus pengembalian dan pemilihan varietas yang tidak tepat dapat mempengaruhi efektivitas strategi.
- Tidak ada biaya transaksi, dan mungkin tidak terlalu efektif.
Tanggapan:
- Parameter untuk mengoptimalkan indikator RO dan RB.
- Menambahkan kondisi penyaringan untuk menghindari transaksi yang sering terjadi.
- Pilih siklus dan varietas yang sesuai.
- Menghitung dan mempertimbangkan biaya transaksi.
Optimasi Strategi
Strategi ini juga dapat dioptimalkan dalam beberapa hal:
- Menambahkan fungsi Smooth pada indikator RO untuk menghindari indikator yang sangat berfluktuasi.
- Bergabunglah dengan strategi stop loss untuk mengendalikan kerugian tunggal.
- Perdagangan dalam kombinasi dengan indikator lain untuk meningkatkan probabilitas keuntungan.
- Menambahkan model pembelajaran mesin untuk membuat prediksi dan menilai efektivitas indikator.
- Optimalisasi parameter yang berbeda untuk meningkatkan adaptasi.
Meringkaskan
Strategi ini intuitif, mudah dibaca, sederhana untuk diterapkan, dan memiliki nilai praktis tertentu. Namun, ada juga beberapa risiko, yang perlu dioptimalkan untuk parameter dan aturan perdagangan, mengurangi risiko, dan meningkatkan efektivitas di lapangan.
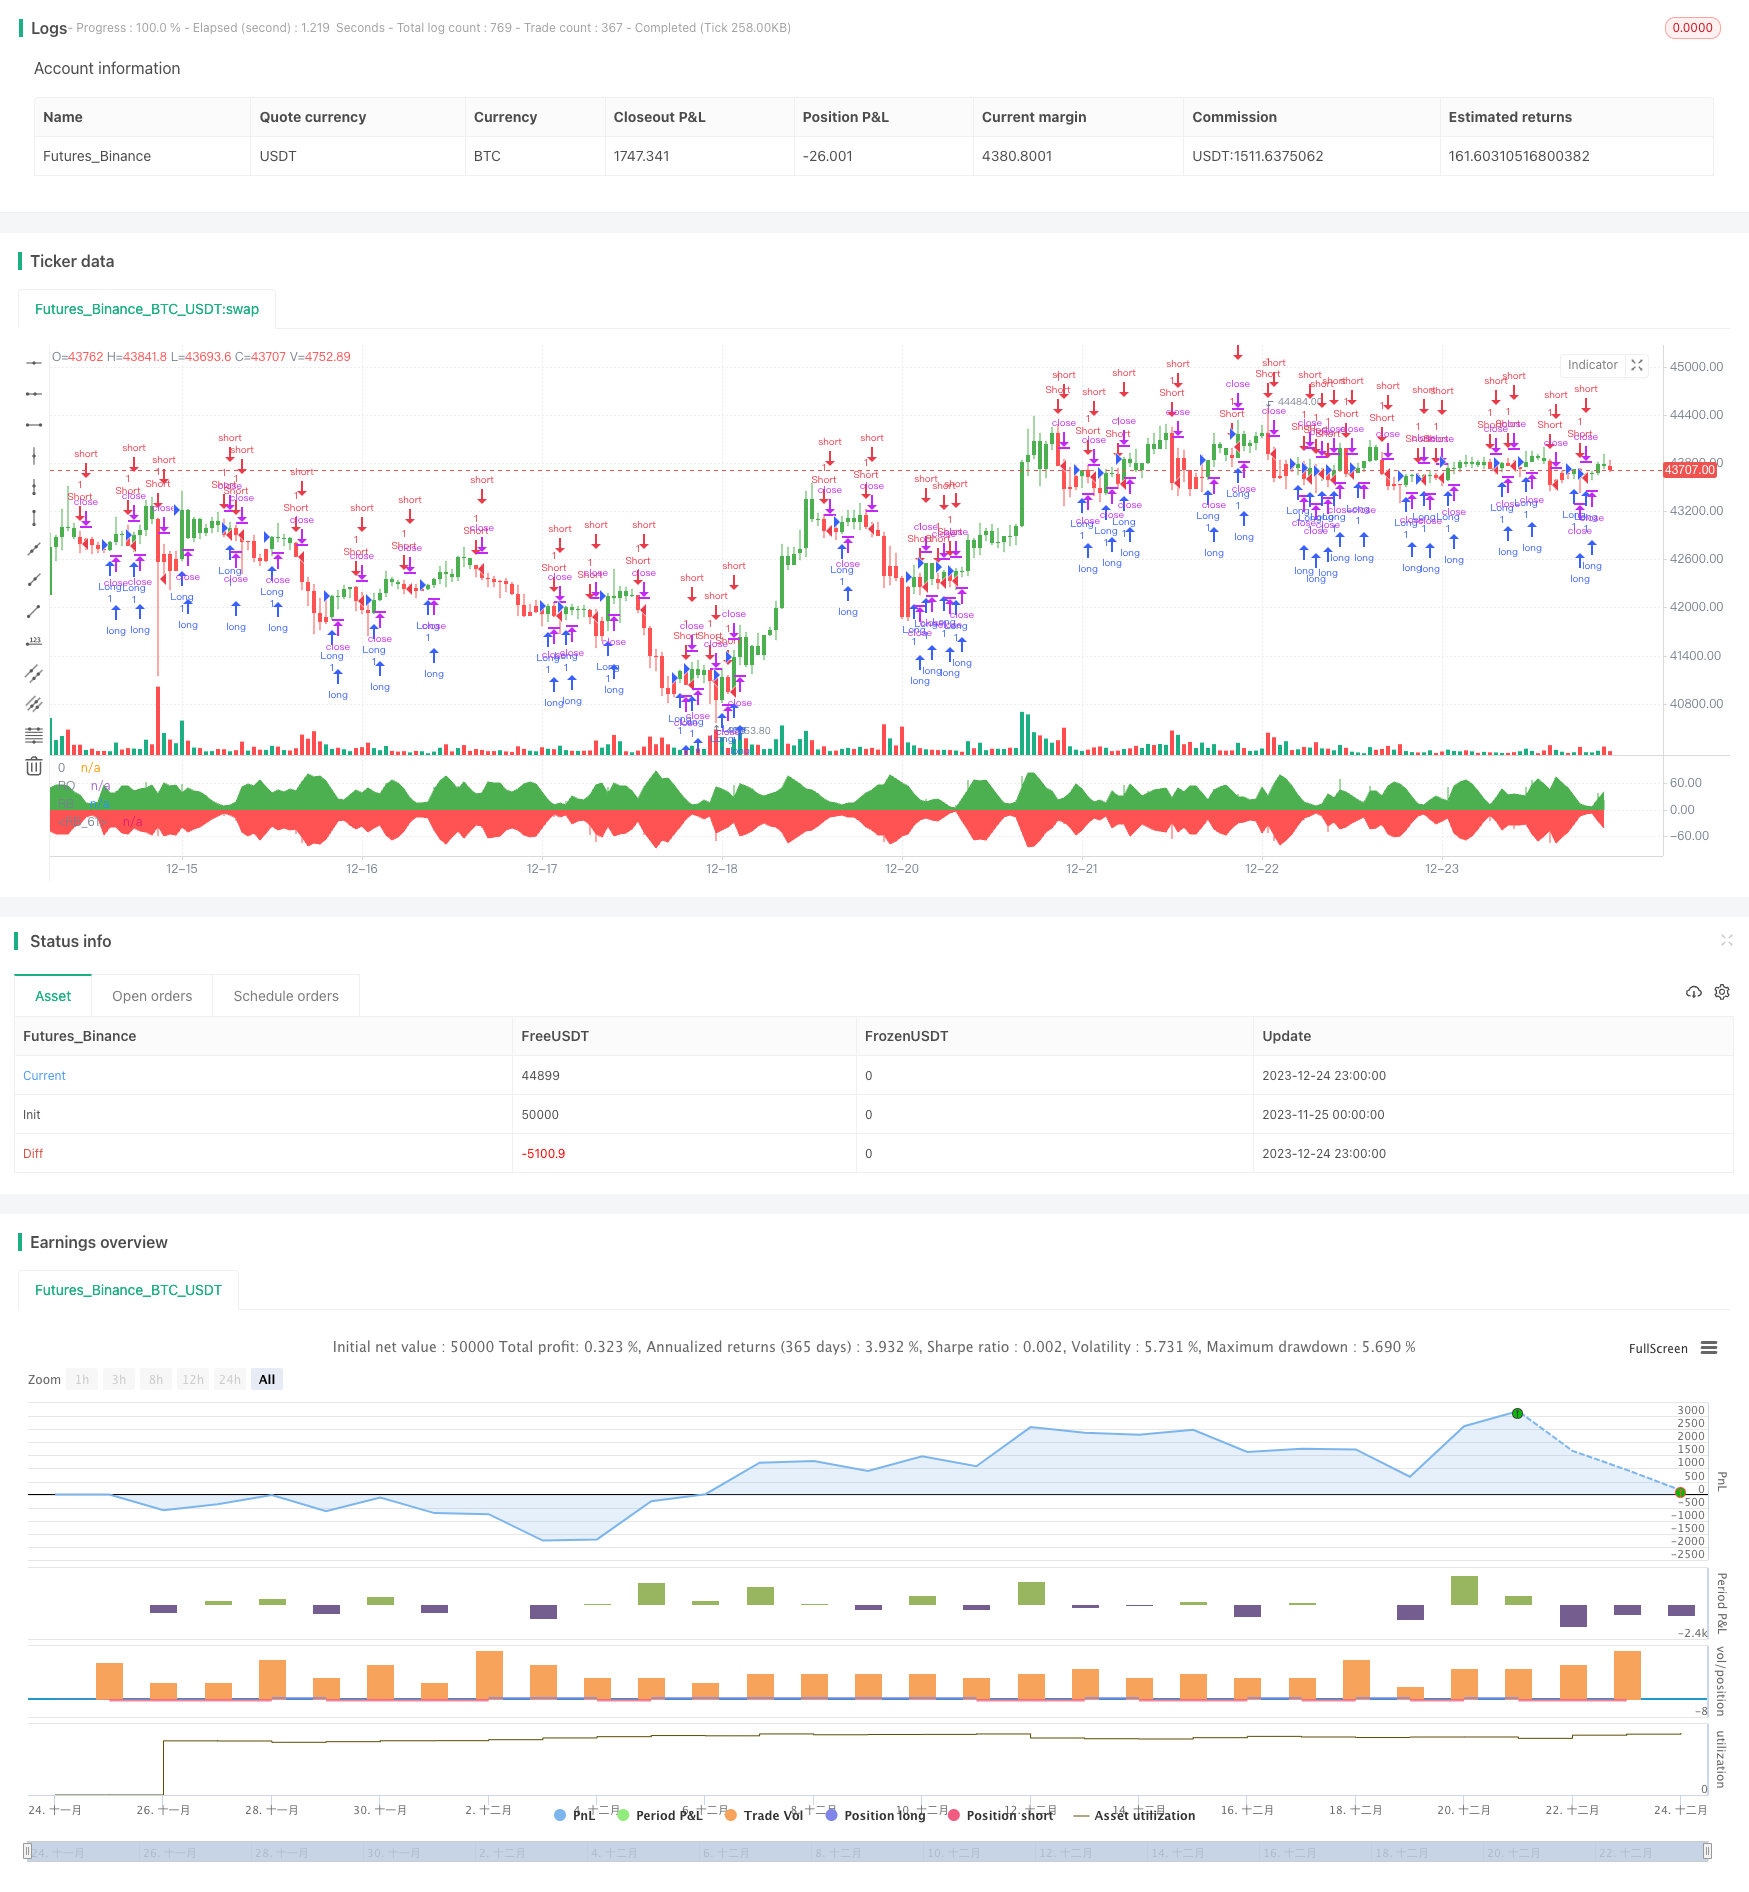
/*backtest
start: 2023-11-25 00:00:00
end: 2023-12-25 00:00:00
period: 1h
basePeriod: 15m
exchanges: [{"eid":"Futures_Binance","currency":"BTC_USDT"}]
*/

//@version=2
////////////////////////////////////////////////////////////
//  Copyright by HPotter v1.0 18/03/2018
// Ever since the people concluded that stock market price movements are not
// random or chaotic, but follow specific trends that can be forecasted, they
// tried to develop different tools or procedures that could help them identify
// those trends. And one of those financial indicators is the Rainbow Oscillator
// Indicator. The Rainbow Oscillator Indicator is relatively new, originally
// introduced in 1997, and it is used to forecast the changes of trend direction.
//
// As market prices go up and down, the oscillator appears as a direction of the
// trend, but also as the safety of the market and the depth of that trend. As
// the rainbow grows in width, the current trend gives signs of continuity, and
// if the value of the oscillator goes beyond 80, the market becomes more and more
// unstable, being prone to a sudden reversal. When prices move towards the rainbow
// and the oscillator becomes more and more flat, the market tends to remain more
// stable and the bandwidth decreases. Still, if the oscillator value goes below 20,
// the market is again, prone to sudden reversals. The safest bandwidth value where
// the market is stable is between 20 and 80, in the Rainbow Oscillator indicator value.
// The depth a certain price has on a chart and into the rainbow can be used to judge
// the strength of the move.
//
// You can change long to short in the Input Settings
// WARNING:
//  - For purpose educate only
//  - This script to change bars colors.
////////////////////////////////////////////////////////////
strategy(title="Rainbow Oscillator Backtest")
Length = input(2, minval=1)
LengthHHLL = input(10, minval=2, title="HHV/LLV Lookback")
reverse = input(false, title="Trade reverse")
xMA1 = sma(close, Length)
xMA2 = sma(xMA1, Length)
xMA3 = sma(xMA2, Length)
xMA4 = sma(xMA3, Length)
xMA5 = sma(xMA4, Length)
xMA6 = sma(xMA5, Length)
xMA7 = sma(xMA6, Length)
xMA8 = sma(xMA7, Length)
xMA9 = sma(xMA8, Length)
xMA10 = sma(xMA9, Length)
xHH = highest(close, LengthHHLL)
xLL = lowest(close, LengthHHLL)
xHHMAs = max(xMA1,max(xMA2,max(xMA3,max(xMA4,max(xMA5,max(xMA6,max(xMA7,max(xMA8,max(xMA9,xMA10)))))))))
xLLMAs = min(xMA1,min(xMA2,min(xMA3,min(xMA4,min(xMA5,min(xMA6,min(xMA7,min(xMA8,min(xMA9,xMA10)))))))))
xRBO = 100 * ((close - ((xMA1+xMA2+xMA3+xMA4+xMA5+xMA6+xMA7+xMA8+xMA9+xMA10) / 10)) / (xHH - xLL))
xRB = 100 * ((xHHMAs - xLLMAs) / (xHH - xLL))
clr = iff(xRBO >= 0, green, red)
pos = iff(xRBO > 0, 1,
       iff(xRBO < 0, -1, nz(pos[1], 0)))
possig = iff(reverse and pos == 1, -1,
          iff(reverse and pos == -1, 1, pos))
if (possig == 1)
    strategy.entry("Long", strategy.long)
if (possig == -1)
    strategy.entry("Short", strategy.short)
barcolor(possig == -1 ? red: possig == 1 ? green : blue )
plot(xRBO, color=clr, title="RO", style= histogram, linewidth=2)
p0 = plot(0, color = gray, title="0")
p1 = plot(xRB, color=green, title="RB")
p2 = plot(-xRB, color=red, title="RB")
fill(p1, p0, color=green)
fill(p2, p0, color=red)