Strategi Dua Garis RSI Saluran Bollinger Band
Ringkasan
Strategi ini menggabungkan Bollinger Bands dengan indikator RSI yang relatif kuat (RSI) untuk melakukan overbought dan oversold di RSI, dengan kebutuhan untuk melakukan penembusan Bollinger Bands yang sesuai, sehingga membuat sinyal trading strategi ini lebih ketat dan dapat diandalkan.
Prinsip Strategi
- Dengan menggunakan garis Brin, perhitungan garis tengah, garis atas, dan garis bawah berdasarkan harga penutupan n hari sebelumnya.
- Perhitungan RSI untuk menentukan apakah pasar terlalu bullish atau bearish.
- Hanya ketika indikator RSI menunjukkan overbought (di atas parameter rsi_overbought) dan harga menembus Bollinger Bands, lakukan perdagangan short.
- Perdagangan multi-head dilakukan hanya jika indikator RSI menunjukkan oversold (< rsi_oversold parameter) dan harga menembus Bollinger Bands.
Dengan demikian, strategi ini memanfaatkan karakteristik saluran Brinline dan sinyal overbought dan oversold dari indikator RSI sekaligus, menghindari kesalahan penilaian dari satu indikator, dan lebih dapat diandalkan.
Keunggulan Strategis
- Menggunakan garis Brin dan indikator RSI secara komprehensif, penilaian lebih ketat dan menghindari kesalahan.
- Garis Brin mengatur saluran dinamis yang dapat memahami hukum fluktuasi pasar.
- RSI mengevaluasi overbought dan oversold untuk menghindari kenaikan dan penurunan.
Risiko Strategis
- Jika parameter Brinline tidak disetel dengan benar, rel naik turun tidak dapat secara efektif membungkus harga.
- Jika parameter RSI tidak disetel dengan benar, maka tidak dapat secara efektif menilai overbought dan oversold yang sebenarnya.
- Strategi ini tidak dapat menentukan arah tren dengan sendirinya, tetapi harus digunakan bersama dengan indikator lain.
Untuk menghadapi risiko di atas, parameter harus dioptimalkan, model harus diuji secara ketat, dan indikator lain harus digunakan untuk menilai tren besar.
Arah optimasi strategi
- Uji Brinline dari berbagai parameter periodik untuk menemukan parameter periodik yang optimal.
- Uji parameter RSI yang berbeda untuk menentukan parameter terbaik.
- Indikator lain seperti moving averages dapat digunakan untuk menilai tren keseluruhan.
Meringkaskan
Strategi ini berhasil menggabungkan keunggulan dari Brinline dan RSI, mengeluarkan instruksi perdagangan ketika kedua sinyal muncul secara bersamaan, sehingga dapat secara efektif menghindari kesalahan penilaian indikator tunggal, membuat perdagangan lebih dapat diandalkan. Pada saat yang sama, juga harus mengoptimalkan parameter, pengujian ketat, dan didukung dengan indikator lain untuk menilai tren besar, sehingga meningkatkan stabilitas strategi dan tingkat pengembalian.
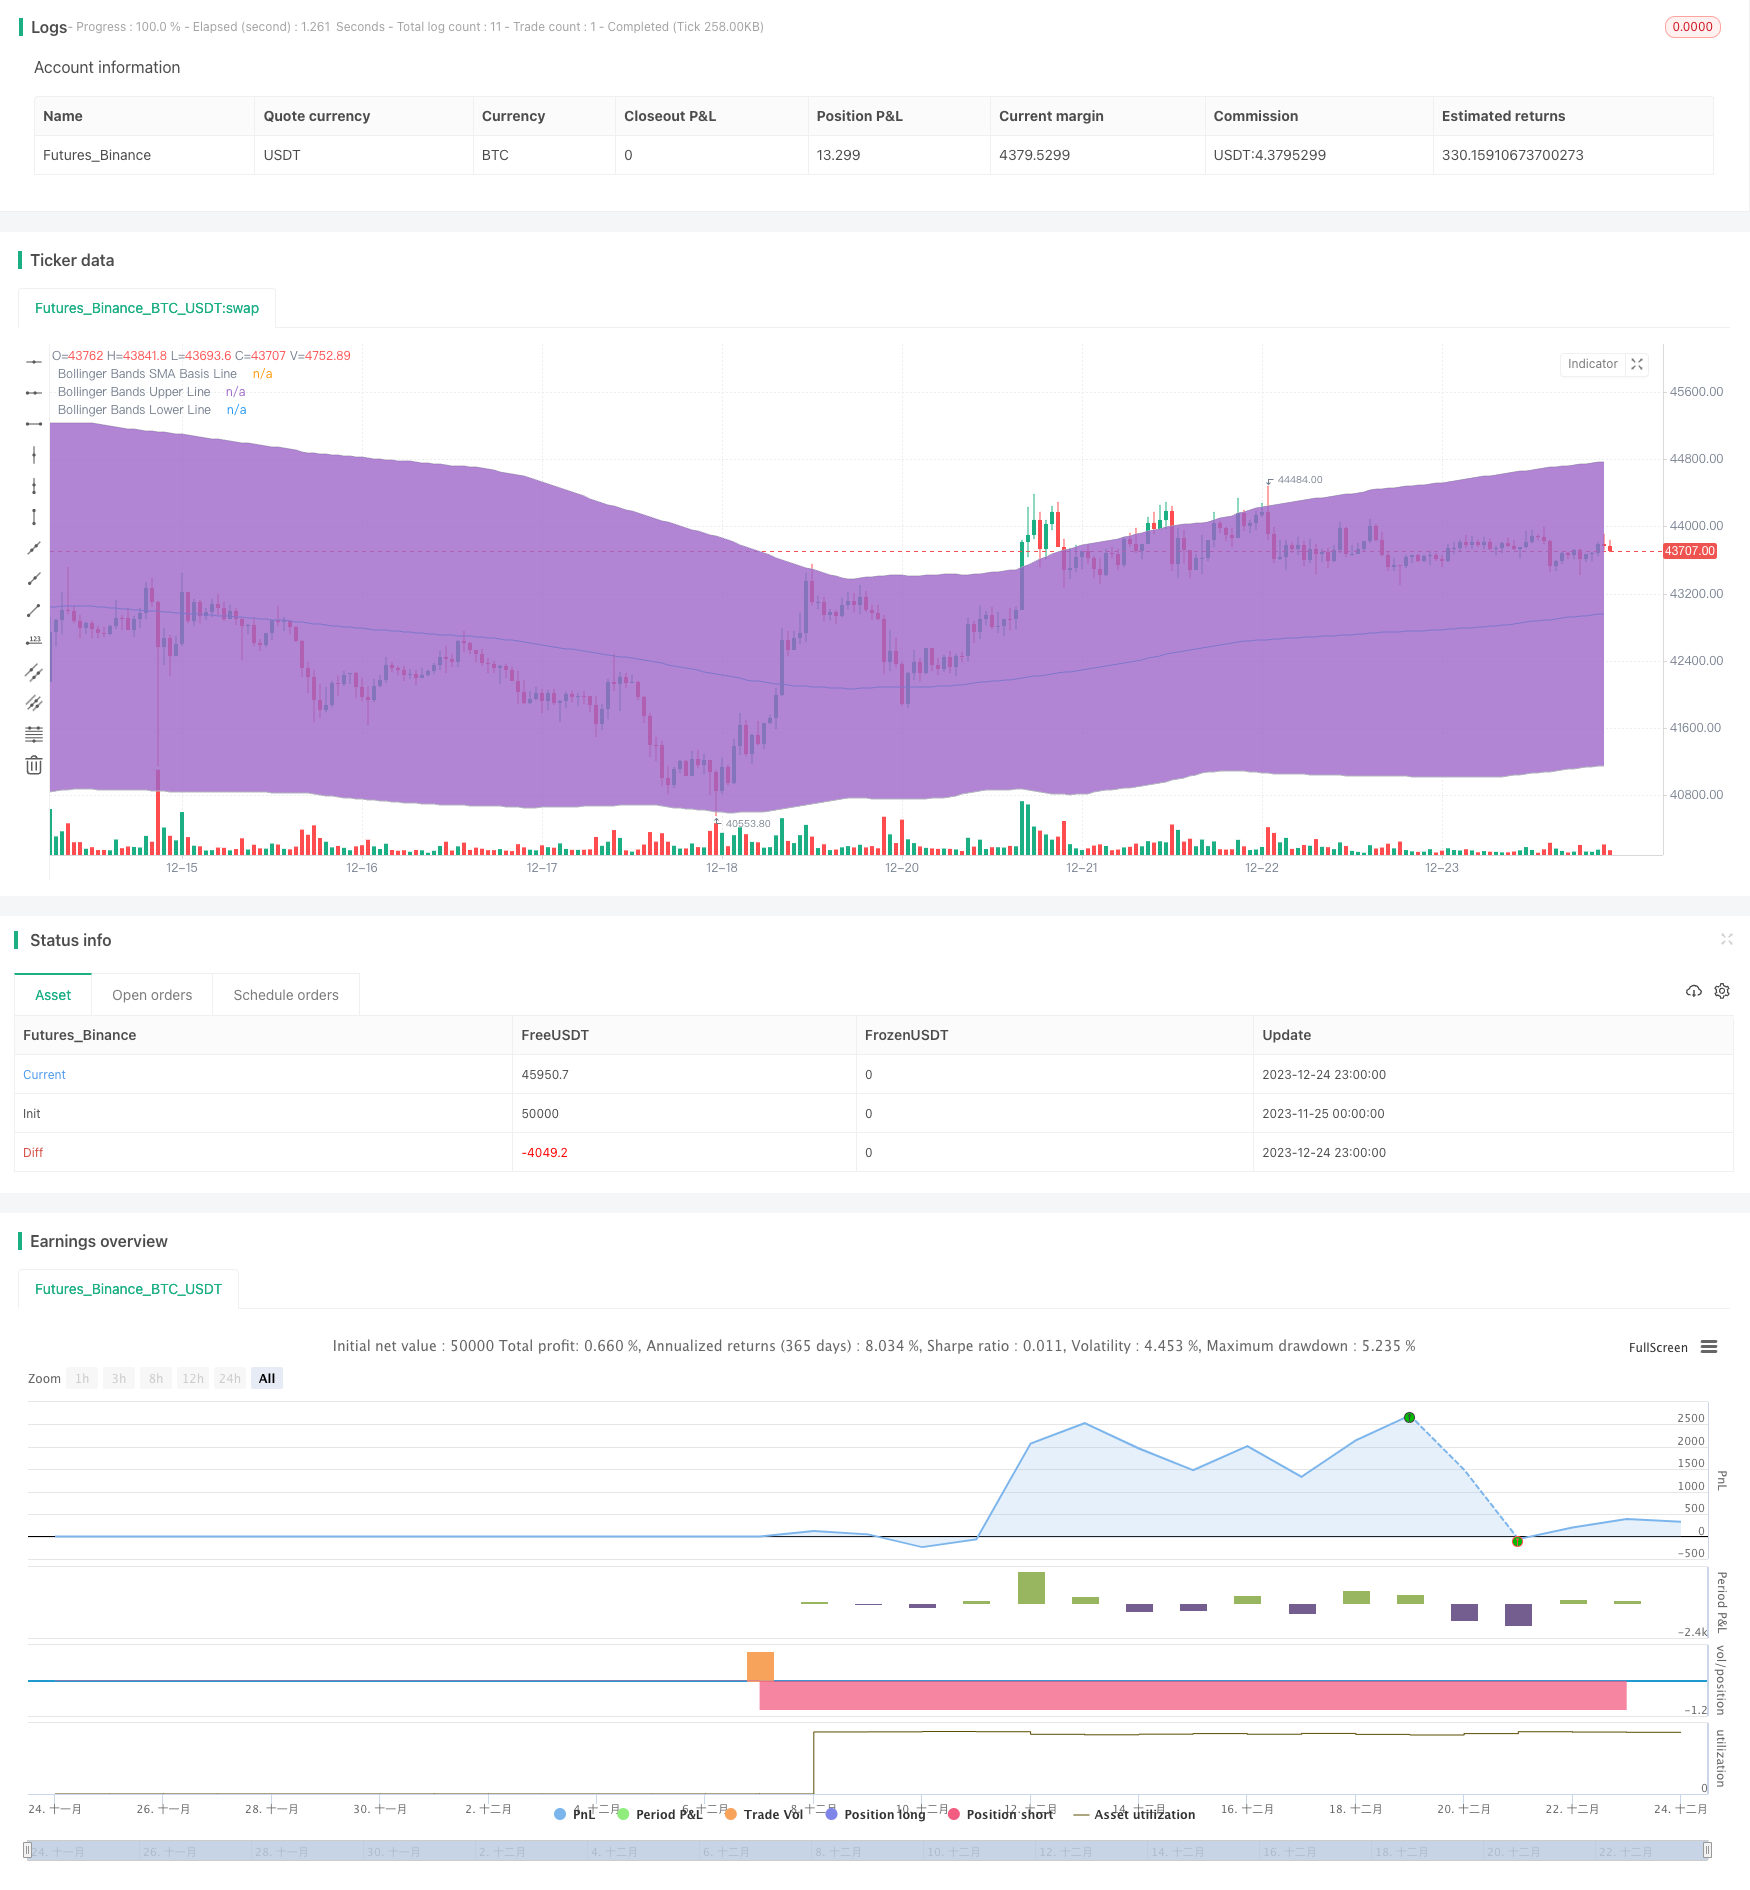
/*backtest
start: 2023-11-25 00:00:00
end: 2023-12-25 00:00:00
period: 1h
basePeriod: 15m
exchanges: [{"eid":"Futures_Binance","currency":"BTC_USDT"}]
*/

//@version=2
strategy("Bollinger + RSI, Double Strategy (by ChartArt) v1.1", shorttitle="CA_-_RSI_Bol_Strat_1.1", overlay=true)

// ChartArt's RSI + Bollinger Bands, Double Strategy - Update
//
// Version 1.1
// Idea by ChartArt on January 18, 2015.
//
// This strategy uses the RSI indicator
// together with the Bollinger Bands
// to sell when the price is above the
// upper Bollinger Band (and to buy when
// this value is below the lower band).
//
// This simple strategy only triggers when
// both the RSI and the Bollinger Bands
// indicators are at the same time in
// a overbought or oversold condition.
//
// In this version 1.1 the strategy was
// both simplified for the user and
// made more successful in backtesting.
//
// List of my work:
// https://www.tradingview.com/u/ChartArt/
//
//  __             __  ___       __  ___
// /  ` |__|  /\  |__)  |   /\  |__)  |
// \__, |  | /~~\ |  \  |  /~~\ |  \  |
//
//


///////////// RSI
RSIlength = input(6,title="RSI Period Length")
RSIoverSold = 50
RSIoverBought = 50
price = close
vrsi = rsi(price, RSIlength)


///////////// Bollinger Bands
BBlength = input(200, minval=1,title="Bollinger Period Length")
BBmult = 2 // input(2.0, minval=0.001, maxval=50,title="Bollinger Bands Standard Deviation")
BBbasis = sma(price, BBlength)
BBdev = BBmult * stdev(price, BBlength)
BBupper = BBbasis + BBdev
BBlower = BBbasis - BBdev
source = close
buyEntry = crossover(source, BBlower)
sellEntry = crossunder(source, BBupper)
plot(BBbasis, color=aqua,title="Bollinger Bands SMA Basis Line")
p1 = plot(BBupper, color=silver,title="Bollinger Bands Upper Line")
p2 = plot(BBlower, color=silver,title="Bollinger Bands Lower Line")
fill(p1, p2)


///////////// Colors
switch1=input(true, title="Enable Bar Color?")
switch2=input(true, title="Enable Background Color?")
TrendColor = RSIoverBought and (price[1] > BBupper and price < BBupper) and BBbasis < BBbasis[1] ? red : RSIoverSold and (price[1] < BBlower and price > BBlower) and BBbasis > BBbasis[1] ? green : na
barcolor(switch1?TrendColor:na)
bgcolor(switch2?TrendColor:na,transp=50)


///////////// RSI + Bollinger Bands Strategy
if (not na(vrsi))

    if (crossover(vrsi, RSIoverSold) and crossover(source, BBlower))
        strategy.entry("RSI_BB_L", strategy.long, stop=BBlower,  comment="RSI_BB_L")
    else
        strategy.cancel(id="RSI_BB_L")

    if (crossunder(vrsi, RSIoverBought) and crossunder(source, BBupper))
        strategy.entry("RSI_BB_S", strategy.short, stop=BBupper,  comment="RSI_BB_S")
    else
        strategy.cancel(id="RSI_BB_S")

//plot(strategy.equity, title="equity", color=red, linewidth=2, style=areabr)