Strategi Beli dan Jual Bullish Engulfing
Ringkasan
Strategi Bullish Engulfing adalah strategi perdagangan kuantitatif yang didasarkan pada bentuk garis K. Strategi ini menangkap peluang untuk membalikkan harga saham dan menghasilkan keuntungan dengan mengidentifikasi bentuk garis K.
Keuntungan utama dari strategi ini adalah:
- Berdasarkan teori analisis teknis yang telah terbukti, mengidentifikasi peluang harga yang mungkin akan berbalik
- Sinyal perdagangan sederhana dan intuitif
- Risiko yang Dapat Dikendalikan
Prinsip Strategi
Strategi ini didasarkan pada Bullish Engulfing, yang merupakan bentuk K-line.
Ketika saham sedang dalam tren turun, jika ada entitas yang lebih kecil dari garis K, entitas yang mengikuti garis K berikutnya benar-benar menelan entitas dari garis K sebelumnya, dan harga penutupan lebih tinggi dari harga tertinggi dari garis K sebelumnya, yaitu membentuk Bullish Engulfing Sunflower, yang mengindikasikan bahwa harga akan berbalik dan harga saham akan naik.
Strategi ini akan membuka lebih banyak posisi saat mengidentifikasi bentuk Bullish Engulfing, dan mengatur Stop Stop Exit, dengan target profit 1%, stop loss 1%, dan lock profit.
Analisis Keunggulan Strategi
Strategi ini memiliki keuntungan sebagai berikut:
- Berdasarkan teori analisis teknis yang telah terbukti, Bullish Engulfing adalah sinyal harga yang memiliki probabilitas tinggi yang dapat secara efektif menangkap peluang harga yang berbalik.
- Sinyal perdagangan sederhana, intuitif, mudah dipahami, dan cocok untuk perdagangan kuantitatif.
- Menggunakan varietas likuiditas tinggi seperti indeks saham berjangka, dapat mencapai masuk dan keluar yang efisien.
- Dengan setting Stop Stop Loss Exit, Anda dapat mengontrol rasio keuntungan dan kerugian dari setiap transaksi, memastikan hasil yang menguntungkan, dan menghindari kerugian besar.
- Parameter strategi dapat disesuaikan secara fleksibel dengan varietas dan kondisi pasar yang berbeda.
Analisis Risiko Strategi
Strategi ini juga memiliki beberapa risiko:
- Berdasarkan teori analisis teknis, ada risiko tertentu dari sinyal yang salah.
- Perubahan kondisi pasar dapat menyebabkan parameter tidak berlaku dan perlu disesuaikan.
- Stop loss yang terlalu kecil dapat menyebabkan stop loss kecil, dan terlalu besar dapat meningkatkan kerugian.
Untuk mengatasi risiko tersebut, kita dapat mengambil langkah-langkah berikut:
- Parameter optimasi untuk memverifikasi efektivitas di berbagai pasar.
- Peningkatan stop loss, memastikan bahwa stop loss tunggal dikendalikan dalam kisaran yang dapat ditanggung.
- Jenis perdagangan dengan likuiditas yang baik dan volatilitas sedang, seperti indeks atau indeks saham.
Arah optimasi strategi
Strategi ini juga dapat dioptimalkan dengan:
- Menggabungkan penyaringan indikator tren, misalnya menambahkan penilaian rata-rata, menghindari perdagangan berlawanan arah.
- Meningkatkan stop loss dan memperluas ruang keuntungan.
- Mengoptimalkan mekanisme stop loss, misalnya meningkatkan stop loss secara bertahap seiring dengan pergerakan harga, mengurangi probabilitas stop loss.
- Menggunakan kombinasi bentuk K lain yang mirip dengan Bullish Engulfing untuk membentuk portofolio transaksi.
Meringkaskan
Strategi Bullish Engulfing adalah strategi perdagangan kuantitatif berbasis analisis teknis yang telah terbukti, dengan sinyal perdagangan yang ringkas, jelas, dan mudah diterapkan. Dengan optimasi parameter dan langkah-langkah pengendalian risiko, Anda dapat memperoleh keuntungan yang stabil.
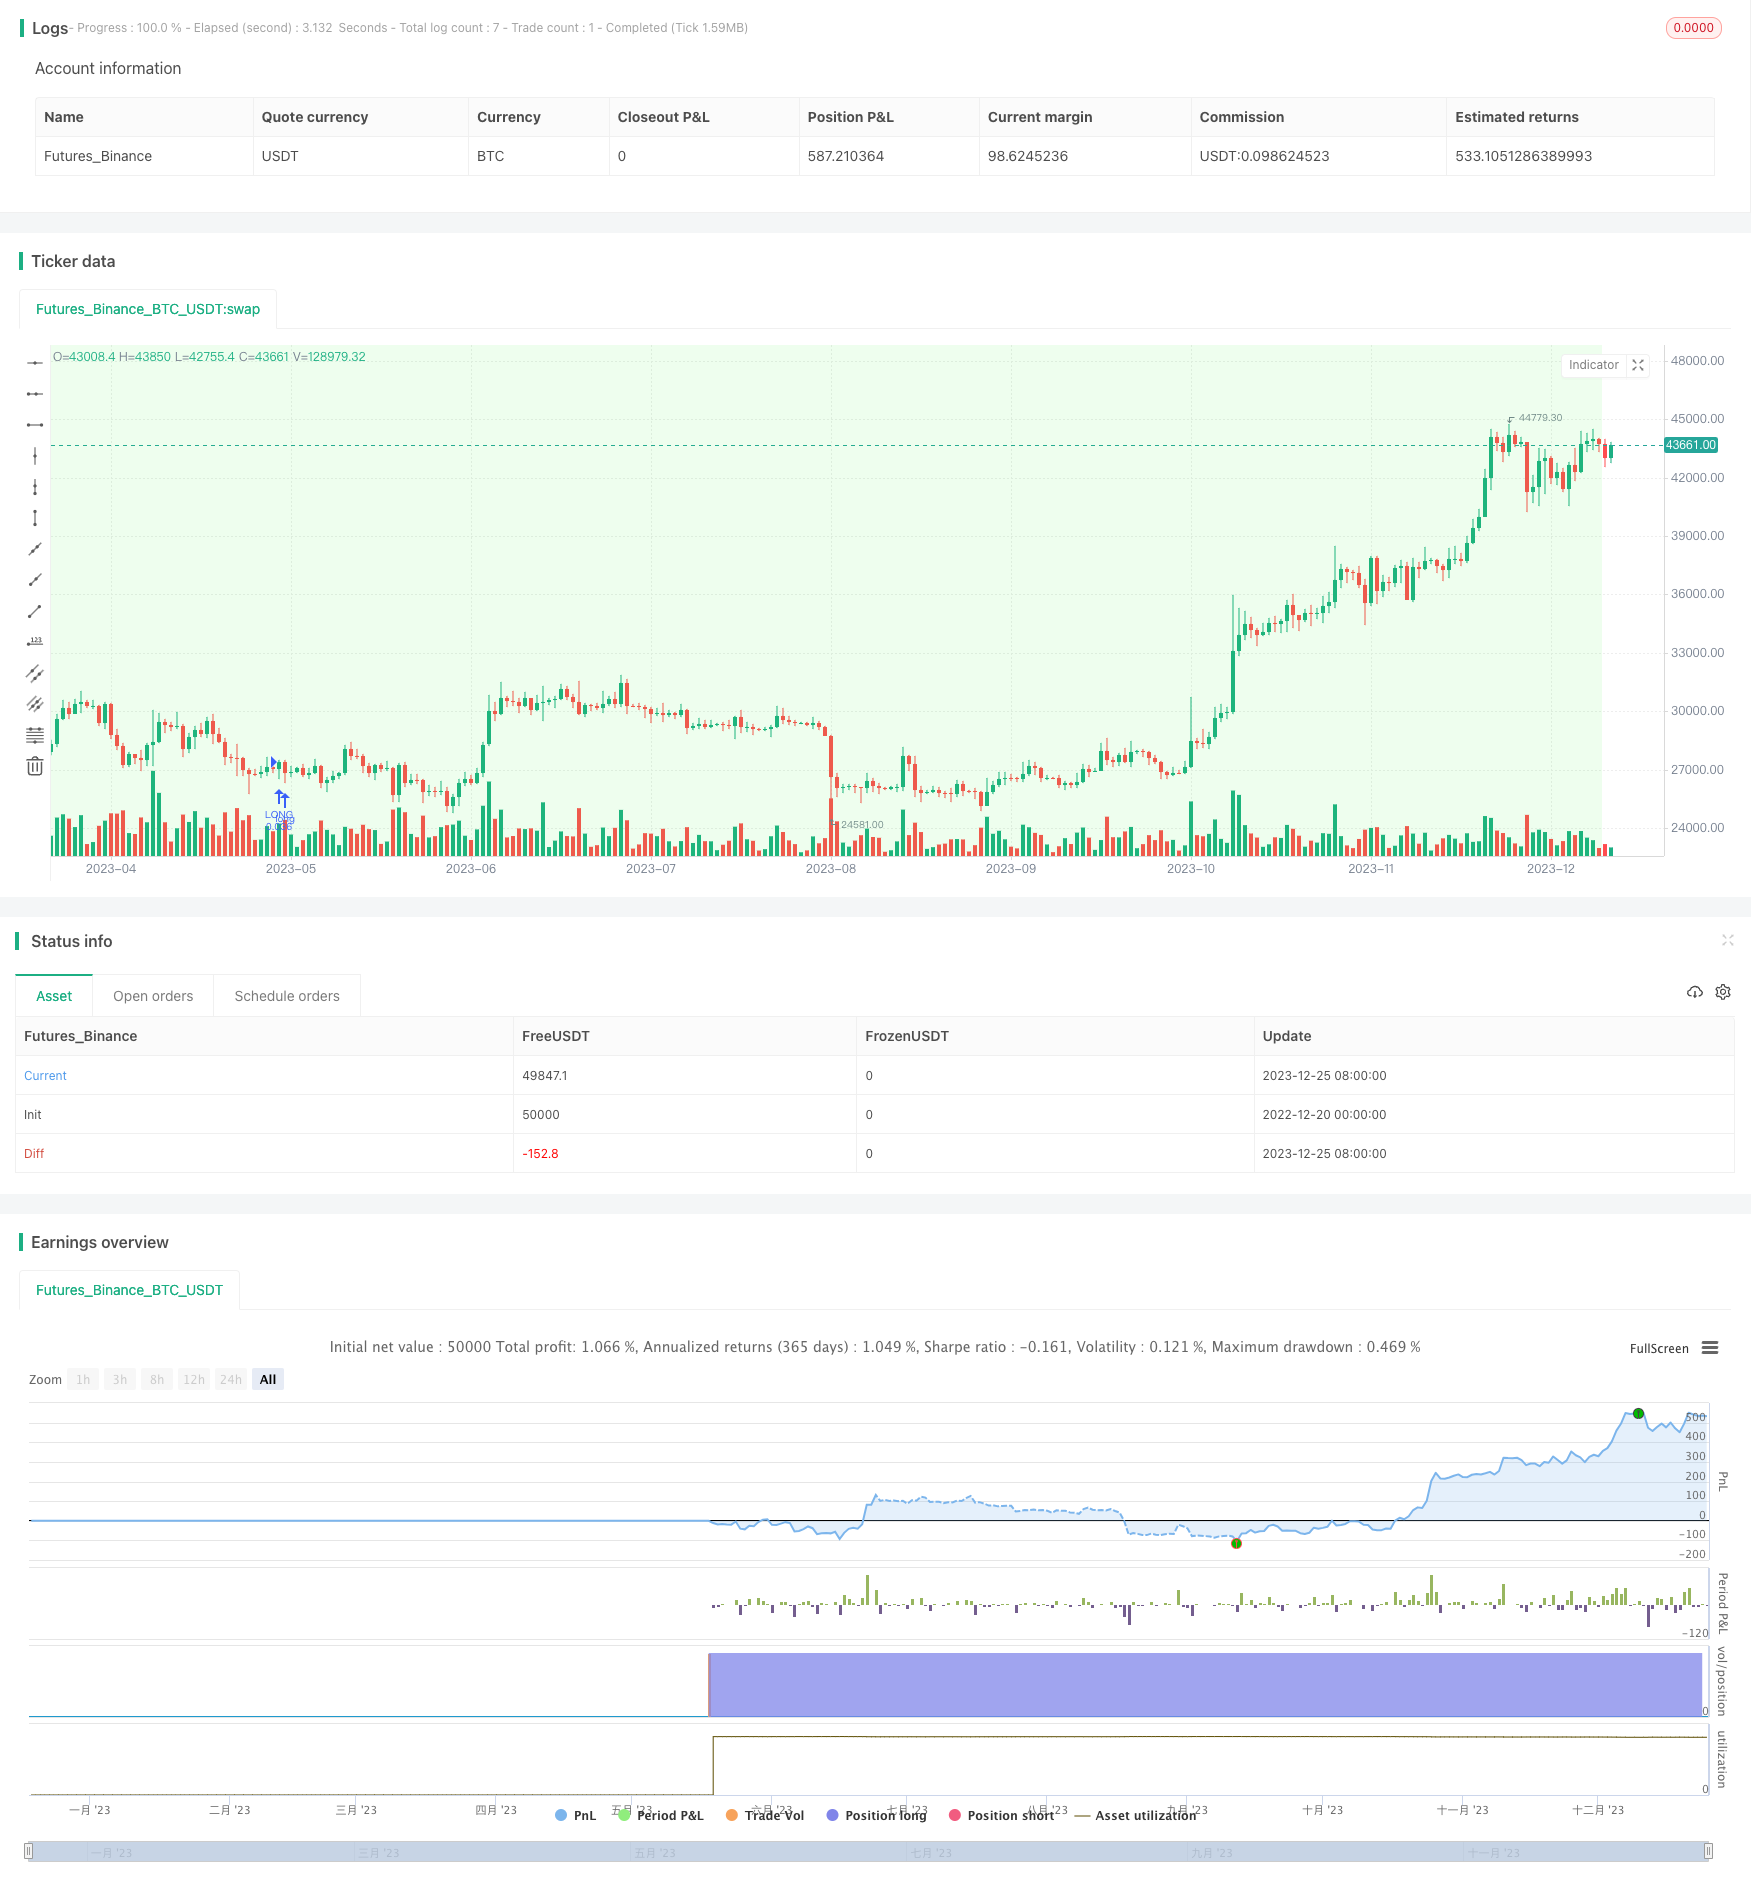
/*backtest
start: 2022-12-20 00:00:00
end: 2023-12-26 00:00:00
period: 1d
basePeriod: 1h
exchanges: [{"eid":"Futures_Binance","currency":"BTC_USDT"}]
*/

// This source code is subject to the terms of the Mozilla Public License 2.0 at https://mozilla.org/MPL/2.0/
// © thequantscience

// ██████╗ ██╗   ██╗██╗     ██╗     ██╗███████╗██╗  ██╗    ███████╗███╗   ██╗ ██████╗ ██╗   ██╗██╗     ███████╗██╗███╗   ██╗ ██████╗
// ██╔══██╗██║   ██║██║     ██║     ██║██╔════╝██║  ██║    ██╔════╝████╗  ██║██╔════╝ ██║   ██║██║     ██╔════╝██║████╗  ██║██╔════╝
// ██████╔╝██║   ██║██║     ██║     ██║███████╗███████║    █████╗  ██╔██╗ ██║██║  ███╗██║   ██║██║     █████╗  ██║██╔██╗ ██║██║  ███╗
// ██╔══██╗██║   ██║██║     ██║     ██║╚════██║██╔══██║    ██╔══╝  ██║╚██╗██║██║   ██║██║   ██║██║     ██╔══╝  ██║██║╚██╗██║██║   ██║
// ██████╔╝╚██████╔╝███████╗███████╗██║███████║██║  ██║    ███████╗██║ ╚████║╚██████╔╝╚██████╔╝███████╗██║     ██║██║ ╚████║╚██████╔╝
// ╚═════╝  ╚═════╝ ╚══════╝╚══════╝╚═╝╚══════╝╚═╝  ╚═╝    ╚══════╝╚═╝  ╚═══╝ ╚═════╝  ╚═════╝ ╚══════╝╚═╝     ╚═╝╚═╝  ╚═══╝ ╚═════╝

//@version=5
strategy(
     "Buy&Sell Bullish Engulfing - The Quant Science",
     overlay = true,
     default_qty_type = strategy.percent_of_equity,
     default_qty_value = 100,
     pyramiding = 1,
     currency = currency.EUR,
     initial_capital = 10000,
     commission_type = strategy.commission.percent,
     commission_value = 0.07,
     process_orders_on_close = true,
     close_entries_rule = "ANY"
     )

startDate  = input.int(title="D: ", defval=1,    minval=1,    maxval=31,   inline = 'Start', group = "START DATE BACKTESTING", tooltip = "D is Day, M is Month, Y is Year.")
startMonth = input.int(title="M: ", defval=1,    minval=1,    maxval=12,   inline = 'Start', group = "START DATE BACKTESTING", tooltip = "D is Day, M is Month, Y is Year.")
startYear  = input.int(title="Y: ", defval=2022, minval=1800, maxval=2100, inline = 'Start', group = "START DATE BACKTESTING", tooltip = "D is Day, M is Month, Y is Year.")

endDate    = input.int(title="D: ", defval=31,   minval=1,    maxval=31,   inline = 'End',   group = "END DATE BACKTESTING", tooltip = "D is Day, M is Month, Y is Year.")
endMonth   = input.int(title="M: ", defval=12,   minval=1,    maxval=12,   inline = 'End',   group = "END DATE BACKTESTING", tooltip = "D is Day, M is Month, Y is Year.")
endYear    = input.int(title="Y: ", defval=2023, minval=1800, maxval=2100, inline = 'End',   group = "END DATE BACKTESTING", tooltip = "D is Day, M is Month, Y is Year.")

inDateRange = (time >= timestamp(syminfo.timezone, startYear, startMonth, startDate, 0, 0)) and (time < timestamp(syminfo.timezone, endYear, endMonth, endDate, 0, 0))

PROFIT   = input.float(defval = 1, minval = 0, title = "Target profit (%): ", step = 0.10, group = "TAKE PROFIT-STOP LOSS")
STOPLOSS = input.float(defval = 1, minval = 0, title = "Stop Loss (%): ",     step = 0.10, group = "TAKE PROFIT-STOP LOSS")

var float equity_trades = 0
strategy.initial_capital = 50000
equity_trades := strategy.initial_capital
var float equity   = 0
var float qty_order   = 0
t_ordersize = "Percentage size of each new order. With 'Reinvestment Profit' activate, the size will be calculate on the equity, with 'Reinvestment Profit' deactivate the size will be calculate on the initial capital."
orders_size = input.float(defval = 2, title = "Orders size (%): ", minval = 0.10, step = 0.10,  maxval = 100, group = "RISK MANAGEMENT", tooltip = t_ordersize)
qty_order := ((equity_trades * orders_size) / 100 ) / close

C_DownTrend = true
C_UpTrend   = true
var trendRule1 = "SMA50"
var trendRule2 = "SMA50, SMA200"
var trendRule = input.string(trendRule1, "Detect Trend Based On", options=[trendRule1, trendRule2, "No detection"], group = "BULLISH ENGULFING")

if trendRule == trendRule1
	priceAvg = ta.sma(close, 50)
	C_DownTrend := close < priceAvg
	C_UpTrend := close > priceAvg

if trendRule == trendRule2
	sma200 = ta.sma(close, 200)
	sma50  = ta.sma(close, 50)
	C_DownTrend := close < sma50 and sma50 < sma200
	C_UpTrend := close > sma50 and sma50 > sma200
C_Len = 14
C_ShadowPercent = 5.0
C_ShadowEqualsPercent = 100.0
C_DojiBodyPercent = 5.0
C_Factor = 2.0

C_BodyHi = math.max(close, open)
C_BodyLo = math.min(close, open)
C_Body = C_BodyHi - C_BodyLo
C_BodyAvg = ta.ema(C_Body, C_Len)
C_SmallBody = C_Body < C_BodyAvg
C_LongBody = C_Body > C_BodyAvg
C_UpShadow = high - C_BodyHi
C_DnShadow = C_BodyLo - low
C_HasUpShadow = C_UpShadow > C_ShadowPercent / 100 * C_Body
C_HasDnShadow = C_DnShadow > C_ShadowPercent / 100 * C_Body
C_WhiteBody = open < close
C_BlackBody = open > close
C_Range = high-low
C_IsInsideBar = C_BodyHi[1] > C_BodyHi and C_BodyLo[1] < C_BodyLo
C_BodyMiddle = C_Body / 2 + C_BodyLo
C_ShadowEquals = C_UpShadow == C_DnShadow or (math.abs(C_UpShadow - C_DnShadow) / C_DnShadow * 100) < C_ShadowEqualsPercent and (math.abs(C_DnShadow - C_UpShadow) / C_UpShadow * 100) < C_ShadowEqualsPercent
C_IsDojiBody = C_Range > 0 and C_Body <= C_Range * C_DojiBodyPercent / 100
C_Doji = C_IsDojiBody and C_ShadowEquals

patternLabelPosLow  = low  - (ta.atr(30) * 0.6)
patternLabelPosHigh = high + (ta.atr(30) * 0.6)

label_color_bullish = input.color(color.rgb(43, 255, 0), title = "Label Color Bullish", group = "BULLISH ENGULFING")
C_EngulfingBullishNumberOfCandles = 2
C_EngulfingBullish = C_DownTrend and C_WhiteBody and C_LongBody and C_BlackBody[1] and C_SmallBody[1] and close >= open[1] and open <= close[1] and ( close > open[1] or open < close[1] )
if C_EngulfingBullish
    var ttBullishEngulfing = "Engulfing\nAt the end of a given downward trend, there will most likely be a reversal pattern. To distinguish the first day, this candlestick pattern uses a small body, followed by a day where the candle body fully overtakes the body from the day before, and closes in the trend’s opposite direction. Although similar to the outside reversal chart pattern, it is not essential for this pattern to completely overtake the range (high to low), rather only the open and the close."
    label.new(bar_index, patternLabelPosLow, text="BE", style=label.style_label_up, color = label_color_bullish, textcolor=color.white, tooltip = ttBullishEngulfing)
bgcolor(ta.highest(C_EngulfingBullish?1:0, C_EngulfingBullishNumberOfCandles)!=0 ? color.new(#21f321, 90) : na, offset=-(C_EngulfingBullishNumberOfCandles-1))

var float c       = 0
var float o       = 0
var float c_exit  = 0
var float c_stopl = 0

if C_EngulfingBullish and strategy.opentrades==0 and inDateRange
    c := strategy.equity
    o := close
    c_exit  := c + (c * PROFIT / 100)
    c_stopl := c - (c * STOPLOSS / 100)
    strategy.entry(id = "LONG", direction = strategy.long, qty = qty_order, limit = o)

if ta.crossover(strategy.equity, c_exit)
    strategy.exit(id = "CLOSE-LONG", from_entry = "LONG", limit = close)
if ta.crossunder(strategy.equity, c_stopl)
    strategy.exit(id = "CLOSE-LONG", from_entry = "LONG", limit = close)