Strategi Overbought dan Oversold RSI Lambat
Ringkasan
Strategi overbought/oversold pada RSI lambat membuka peluang perdagangan baru dengan memperpanjang periode revisi RSI dan mengurangi volatilitas kurva RSI. Strategi ini juga berlaku untuk indikator teknis lainnya seperti MACD.
Prinsip Strategi
Inti dari strategi ini adalah untuk memperpanjang panjang siklus review RSI, dengan default 500 siklus, dan kemudian dengan SMA untuk meluruskan kurva RSI, dengan periode default 250. Hal ini dapat secara signifikan mengurangi volatilitas kurva RSI, memperlambat laju respons RSI, sehingga menghasilkan peluang perdagangan baru.
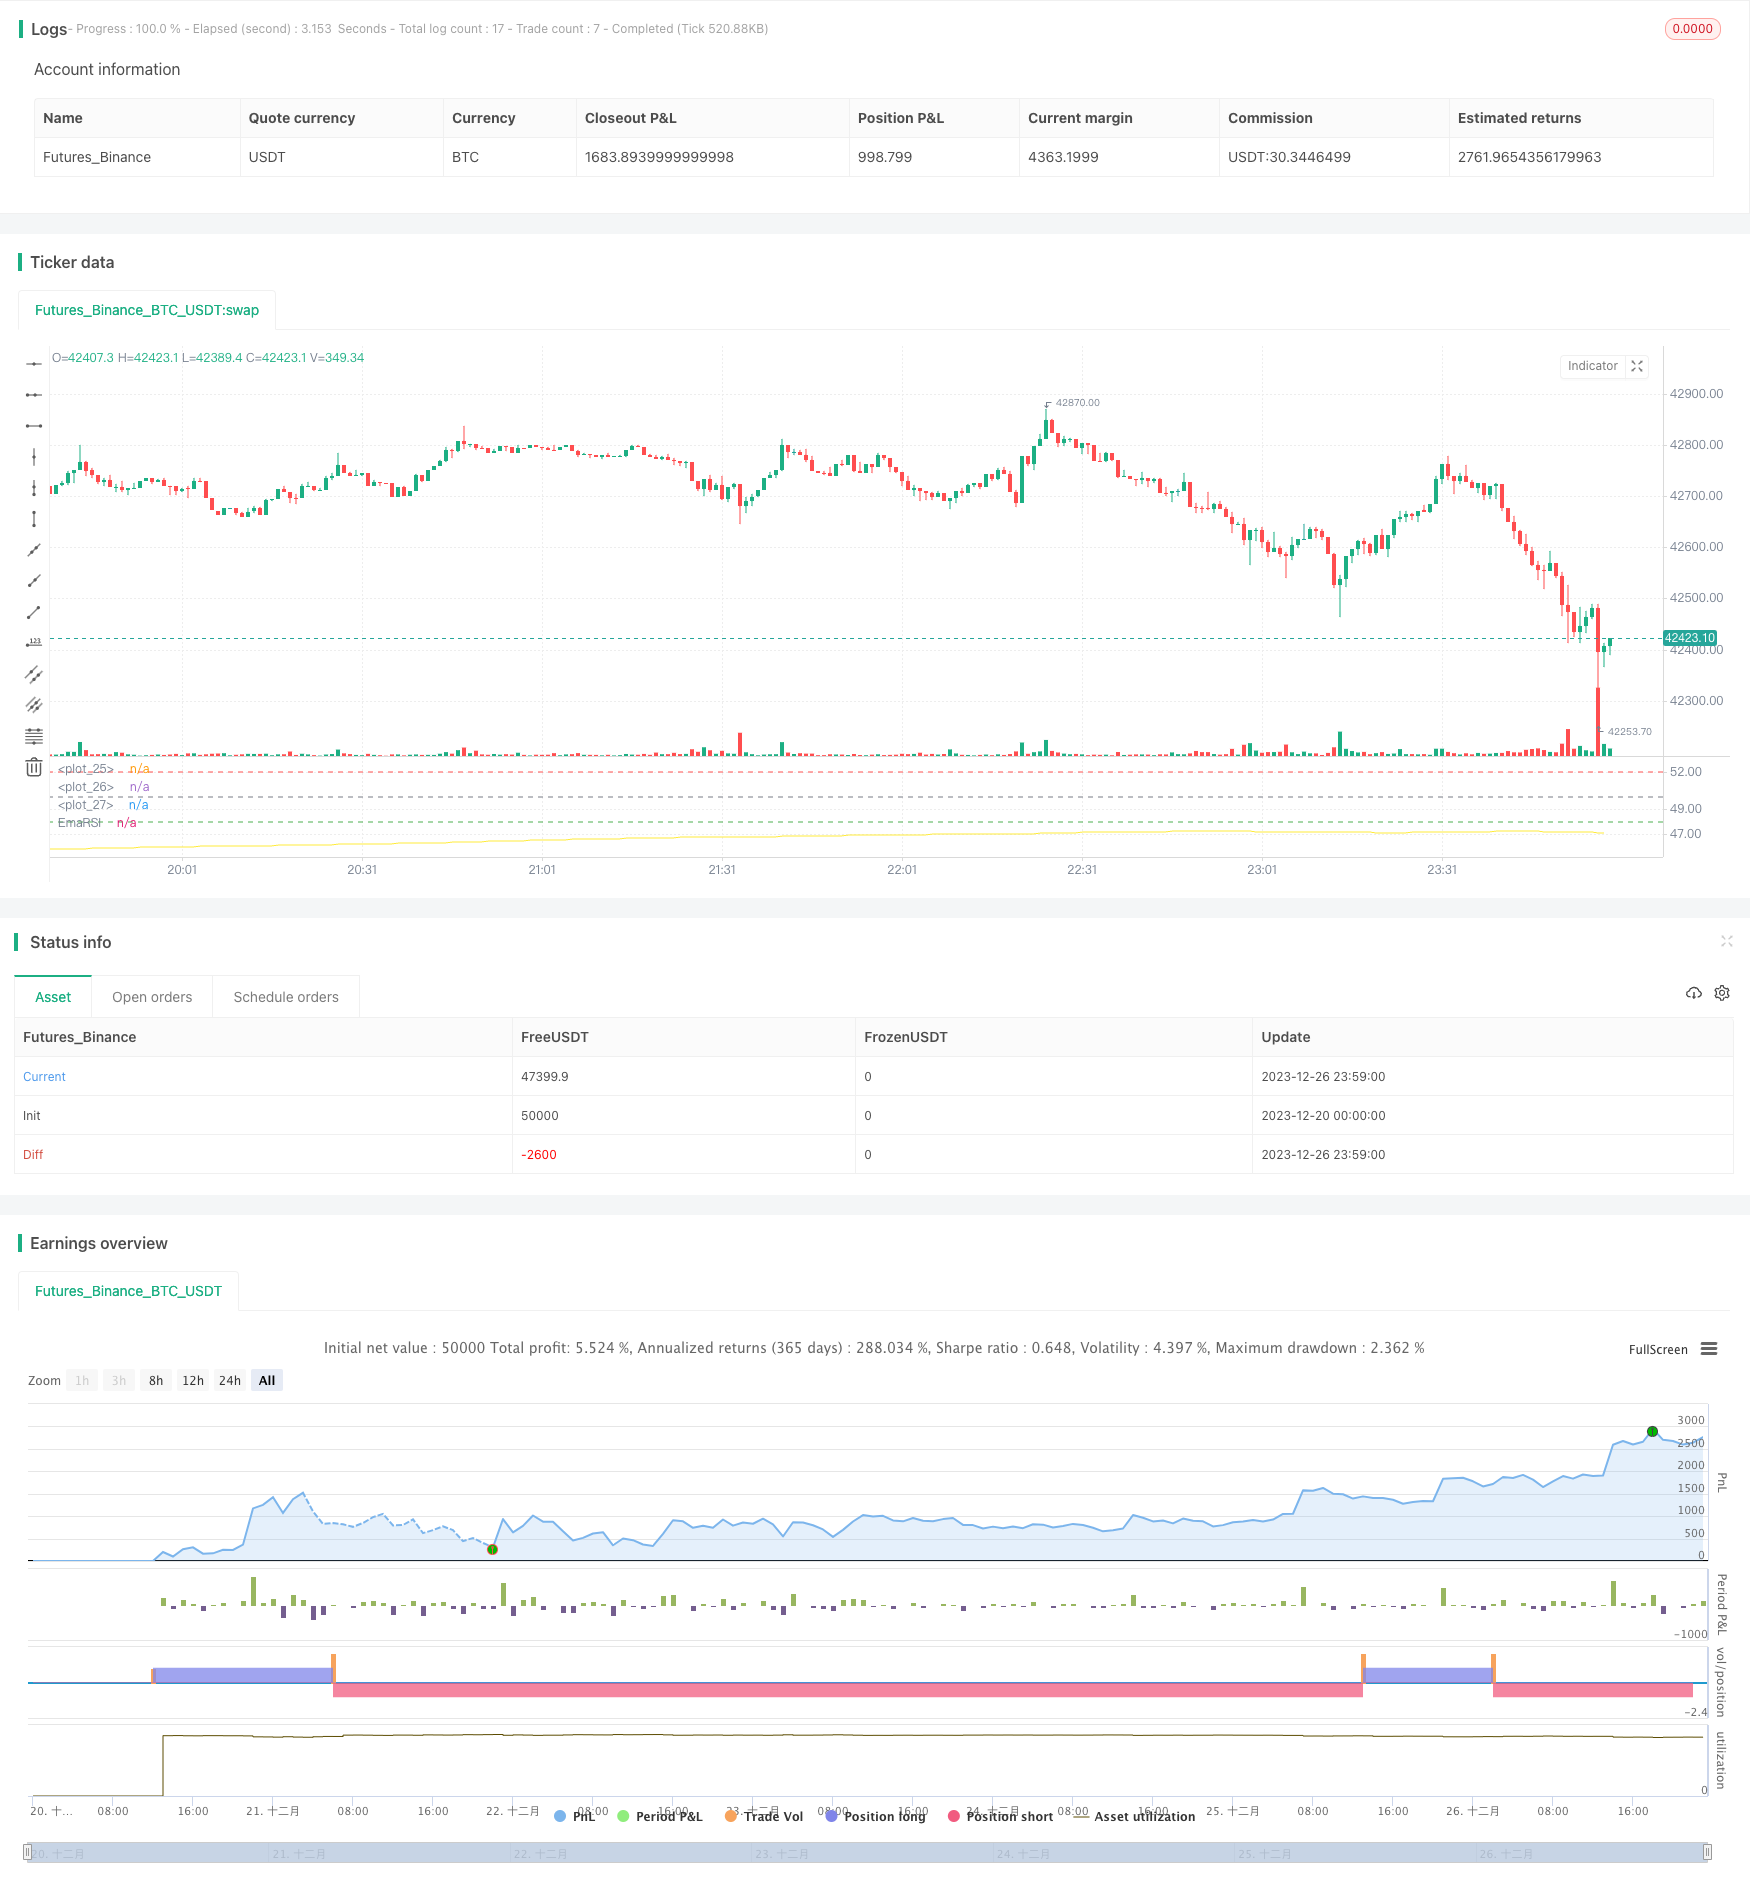
Periode revisi yang terlalu panjang melemahkan volatilitas kurva RSI, sehingga kriteria untuk menilai overbought dan oversold juga perlu disesuaikan. Strategi menyiapkan garis overbought 52 dan oversold 48 yang disesuaikan.
Keunggulan Strategis
- Berinovasi, mengembangkan ide-ide baru dengan memperpanjang siklus
- Hal ini dapat mengurangi sinyal palsu dan meningkatkan stabilitas.
- Customized overbought and oversold thresholds untuk berbagai pasar
- Bisa dipanen, meningkatkan yield
Risiko Strategis
- Periode yang terlalu panjang bisa melewatkan kesempatan untuk berlari lebih pendek.
- Bersabarlah Menunggu Kesempatan untuk Masuk
- Overbought dan oversold, dengan pengaturan yang tidak tepat, dapat meningkatkan kerugian
- Ada risiko untuk melakukan likuidasi
Solusi:
- Mempersingkat siklus dan meningkatkan frekuensi transaksi
- Menggunakan metode batch building untuk menyebarkan risiko
- Optimalkan parameter penurunan nilai untuk menyesuaikan dengan kondisi pasar yang berbeda
- Tetapkan Stop Loss, Hindari Kerugian Besar
Arah optimasi strategi
- Optimalkan parameter RSI untuk menemukan kombinasi siklus terbaik
- Uji berbagai parameter siklus smoothing SMA
- Optimalkan parameter overbought dan oversold untuk pasar yang berbeda
- Menambahkan strategi stop loss untuk mengendalikan kerugian tunggal
Meringkaskan
Strategi overbought oversold RSI yang lambat berhasil membuka ide perdagangan baru dengan cara memperpanjang siklus dan menggunakan hambatan rata-rata untuk menahan fluktuasi. Strategi ini diharapkan menghasilkan keuntungan tambahan yang stabil dan efisien dengan parameter yang dioptimalkan dan kontrol risiko. Secara keseluruhan, strategi ini sangat inovatif dan bernilai digunakan.
/*backtest
start: 2023-12-20 00:00:00
end: 2023-12-27 00:00:00
period: 1m
basePeriod: 1m
exchanges: [{"eid":"Futures_Binance","currency":"BTC_USDT"}]
*/


// Wilder was a very influential man when it comes to TA. However, I'm one to always try to think outside the box.
// While Wilder recommended that the RSI be used only with a 14 bar lookback period, I on the other hand think there is a lot to learn from RSI if one simply slows down the lookback period
// Same applies for MACD.
// Every market has its dynmaics. So don't narrow your mind by thinking my source code input levels are the only levels that work.
// Since the long lookback period weakens the plot volatility, again, one must think outside the box when trying to guage overbought and oversold levels.

// Good luck and don't bash me if some off-the-wall FA spurned divergence causes you to lose money.
// And NO this doesn't repaint and I won't answer those who ask.
//@version=4

strategy("SLOW RSI OB/OS Strategy", overlay=false)
price = input(ohlc4, title="Price Source")
len = input(500, minval=1, step=5,  title="RSI Length")
smoother = input(250, minval=1, step=5, title="RSI SMA")
up = rma(max(change(price), 0), len)
down = rma(-min(change(price), 0), len)
rsi = down == 0 ? 100 : up == 0 ? 0 : 100 - (100 / (1 + up / down))
EmaRSI = ema(rsi,smoother)
plot(EmaRSI, title="EmaRSI", style=line, linewidth=1, color=yellow)


OB = input(52, step=0.1)
OS = input(48, step=0.1)
hline(OB, linewidth=1, color=red)
hline(OS,linewidth=1, color=green)
hline(50,linewidth=1, color=gray)


long = change(EmaRSI) > 0 and EmaRSI <= 50 and crossover(EmaRSI, OS)
short = change(EmaRSI) < 0 and EmaRSI >= 50 and crossunder(EmaRSI, OB)


strategy.entry("Long", strategy.long, when=long) //_signal or long) //or closeshort_signal)
strategy.entry("Short", strategy.short, when=short) //_signal or short) // or closelong_signal)

// If you want to try to play with exits you can activate these!

//closelong = crossunder(EmaRSI, 0) //or crossunder(EmaRSI, OS)
//closeshort = crossover(EmaRSI, 0) //or crossover(EmaRSI, OB)

//strategy.close("Long", when=closelong)
//strategy.close("Short", when=closeshort)