Strategi trailing stop loss dengan rata-rata pergerakan ganda
Ringkasan
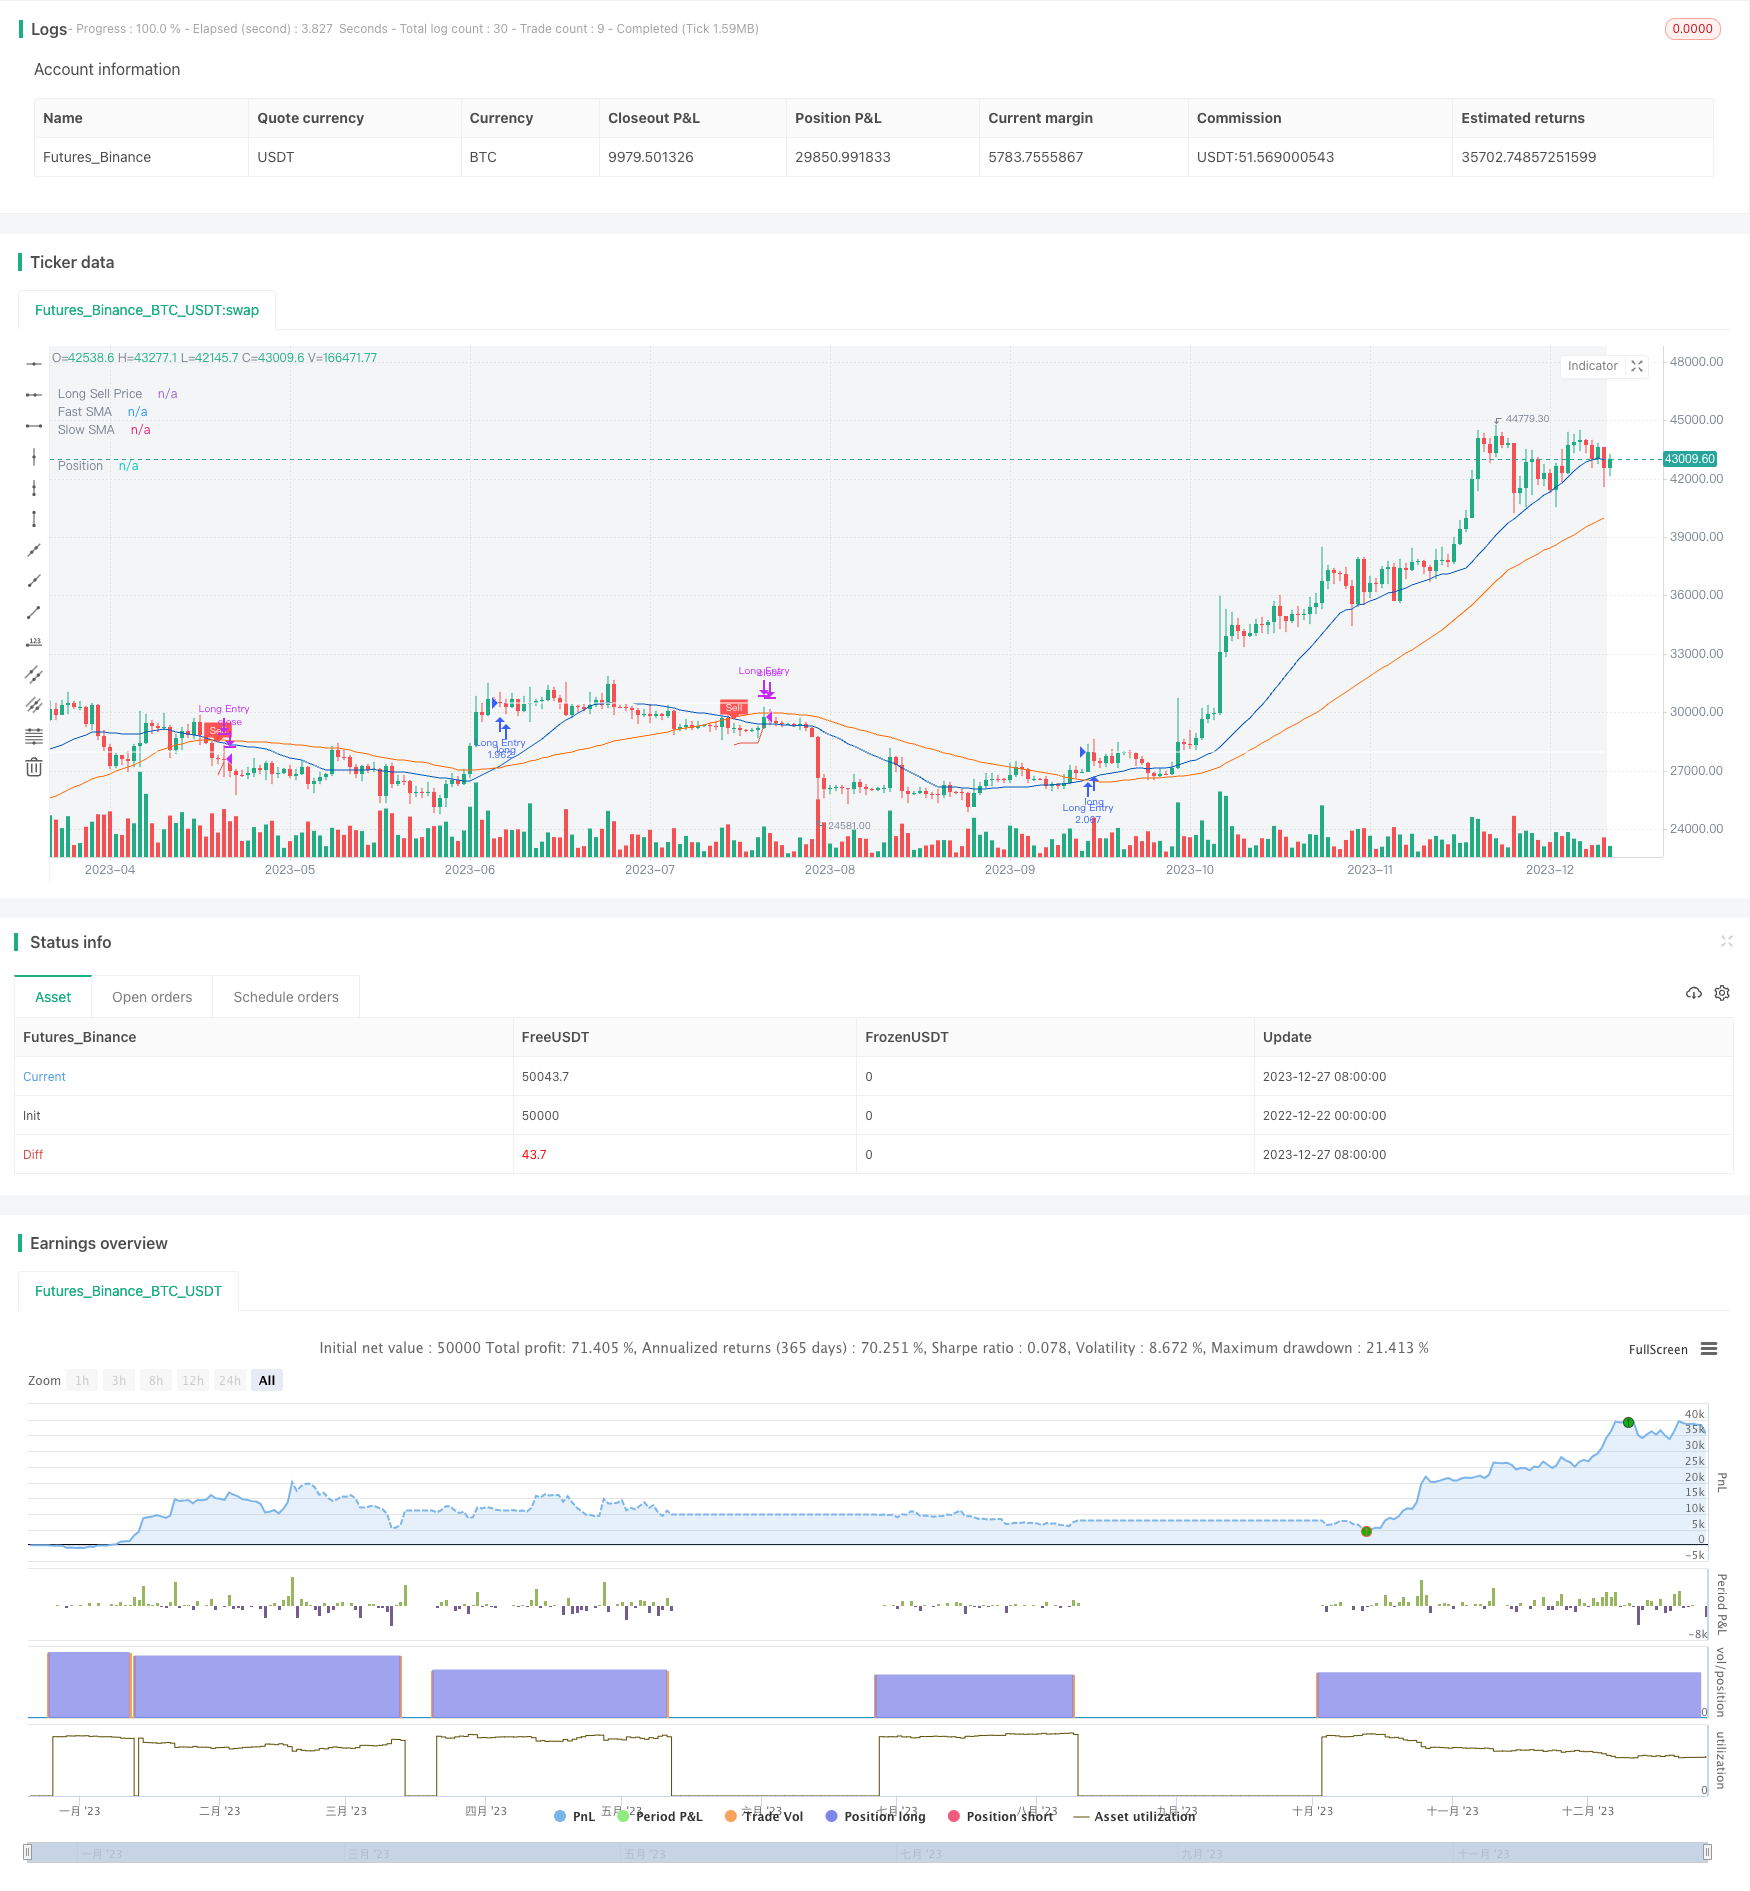
Strategi ini didasarkan pada persimpangan antara rata-rata cepat dan rata-rata lambat untuk memutuskan untuk melakukan shorting lebih banyak. Melakukan shorting ketika rata-rata cepat melewati rata-rata lambat di atas rata-rata cepat, dan melakukan shorting ketika rata-rata cepat melewati rata-rata lambat di bawah rata-rata cepat. Untuk mengejar keuntungan yang lebih tinggi, strategi ini menggunakan mekanisme tracking stop loss.
Prinsip Strategi
Strategi ini menggunakan rata-rata bergerak sederhana cepat (SMA) dan SMA lambat untuk memutuskan kapan harus melakukan posisi yang aman. Ketika SMA cepat melewati SMA lambat, menilai tren berubah ke atas, dan melakukan lebih banyak; Ketika SMA cepat melewati SMA lambat, menilai tren berbalik, bersiaplah untuk posisi yang aman.
Untuk mengejar keuntungan yang lebih tinggi, strategi ini memperkenalkan mekanisme tracking stop loss. Setelah melakukan lebih banyak, tidak akan mengatur stop loss pada harga tetap, tetapi mendirikan harga tracking stop loss, yang akan mengikuti kenaikan harga dan naik, setiap kali harga naik dalam proporsi tertentu, harga tracking stop loss akan disesuaikan ke atas dengan tingkat tertentu.
Secara khusus, rumus untuk melacak harga stop loss adalah sebagai berikut:
Tracking stop loss = harga × (1 - persentase tracking stop loss)
Di antaranya, persentase tracking stop loss diatur oleh parameter strategi column Deviation % column. Strategi akan menghitung tracking stop loss baru setiap kali K baris ditutup setelah membuka posisi. Tracking stop loss baru tidak bisa lebih rendah dari tracking stop loss dari K baris sebelumnya, untuk memastikan bahwa harga stop loss hanya bisa bergerak ke atas, tidak bisa kembali.
Ketika harga turun dan menyentuh harga tracking stop loss, akan memicu sinyal posisi kosong, dan posisi akan menggunakan posisi kosong pada harga pasar.
Keunggulan Strategis
- Menggunakan dua garis keseimbangan untuk menentukan arah tren, pengukuran kembali lebih efektif
- Menggunakan Tracking Stop Loss untuk Mencari Keuntungan yang Lebih Tinggi
- Periode rata-rata dan stop loss yang dapat disesuaikan
- Pada saat tren naik, stop loss line akan terus bergerak ke atas, memastikan sebagian besar keuntungan
- Jika terjadi pergeseran tren, Anda dapat menghentikan kerugian dengan cepat dan menghindari kerugian yang lebih besar.
Risiko dan Solusi
- Waktu persilangan garis rata-rata yang tidak dipilih dengan benar dapat menyebabkan sinyal virtual. Parameter yang berbeda dapat diuji untuk menemukan kombinasi garis rata-rata yang optimal
- Tracking stop loss terlalu radikal dan dapat menyebabkan stop loss terlalu dini. Parameter persentase tracking stop loss dapat disesuaikan sesuai
- Harga muncul di gap harga, atau mungkin langsung menembus harga stop loss. Disarankan untuk mengkombinasikan indikator lain untuk menilai tren, menghindari perdagangan dalam situasi goncangan
Arah optimasi
- Dapat menguji berbagai parameter periodik rata-rata untuk menemukan kombinasi parameter optimal
- Anda dapat menguji parameter persentase tracking stop yang berbeda untuk menemukan tingkat stop yang optimal
- Pertimbangan indikator lain dapat digabungkan untuk menangguhkan perdagangan dalam situasi yang bergejolak untuk menghindari dampak dari peristiwa yang tidak terduga.
Meringkaskan
Strategi ini menggabungkan penggunaan indikator garis rata untuk menentukan arah tren, serta melacak mekanisme stop loss untuk mengunci keuntungan, dalam data pelatihan. Dengan mengoptimalkan kombinasi parameter, mengendalikan risiko, diharapkan untuk mendapatkan keuntungan yang stabil. Namun, tidak ada strategi yang dapat benar-benar menghindari kerugian, disarankan untuk mengatur manajemen posisi yang tepat, menguji varietas yang berbeda, menyebarkan risiko.
/*backtest
start: 2022-12-22 00:00:00
end: 2023-12-28 00:00:00
period: 1d
basePeriod: 1h
exchanges: [{"eid":"Futures_Binance","currency":"BTC_USDT"}]
*/

//@version=5
//
// ▒▒▒▒▒▒▒▒▒▒▒▒▒▒▒▒▒▒▒▒▒▒▒▒▒▒▒▒▒▒▒▒▒▒▒▒▒▒▒▒▒▒▒▒▒▒▒▒▒▒▒▒▒▒▒▒▒▒▒▒▒▒▒▒▒▒▒▒▒▒▒▒▒▒▒▒▒▒▒▒▒▒▒▒▒▒▒▒▒▒▒▒▒▒▒▒▒▒▒▒▒▒▒▒▒▒▒▒▒▒▒▒▒▒
//  -----------------------------------------------------------------------------
//  Copyright 2022 Iason Nikolas | jason5480
//  Trailing Buy script may be freely distributed under the MIT license.
//
//  Permission is hereby granted, free of charge,
//  to any person obtaining a copy of this software and associated documentation files (the "Software"),
//  to deal in the Software without restriction, including without limitation the rights to use, copy, modify, merge,
//  publish, distribute, sublicense, and/or sell copies of the Software, and to permit persons to whom the Software is furnished to do so,
//  subject to the following conditions:
//
//  The above copyright notice and this permission notice shall be included in all copies or substantial portions of the Software.
//
//  THE SOFTWARE IS PROVIDED "AS IS", WITHOUT WARRANTY OF ANY KIND,
//  EXPRESS OR IMPLIED, INCLUDING BUT NOT LIMITED TO THE WARRANTIES OF MERCHANTABILITY,
//  FITNESS FOR A PARTICULAR PURPOSE AND NONINFRINGEMENT. IN NO EVENT SHALL THE AUTHORS OR COPYRIGHT HOLDERS BE LIABLE FOR ANY CLAIM,
//  DAMAGES OR OTHER LIABILITY, WHETHER IN AN ACTION OF CONTRACT, TORT OR OTHERWISE, ARISING FROM,
//  OUT OF OR IN CONNECTION WITH THE SOFTWARE OR THE USE OR OTHER DEALINGS IN THE SOFTWARE.
//
//  -----------------------------------------------------------------------------
//
//  Authors:  @jason5480
//  Revision: v1.0.1
//  Date:     24-Feb-2022
//
//  Description
//  =============================================================================
//  This strategy will go long if fast MA crosses over slow MA.
//  If the 'Enable Trailing` is checked then the strategy instead of exiting from the position
//  directly it will follow the price upwards (percentagewise) with small steps
//  If the price drops by this percentage then the exit order will be executed
//
//  The strategy has the following parameters:
//
//  Fast SMA Length - How many candles back to calculte the fast SMA.
//  Slow SMA Length - How many candles back to calculte the slow SMA.
//  Enable Trailing - Enable or disable the trailing
//  Deviation % - The step to follow the price when the open position condition is met.
//  Source Exit Control - The source price to compare with the exit price to trigger the exit order when trailing.
//
//  -----------------------------------------------------------------------------
//  Disclaimer:
//    1. I am not licensed financial advisors or broker dealer. I do not tell you
//       when or what to buy or sell. I developed this software which enables you
//       execute manual or automated using TradingView. The
//       software allows you to set the criteria you want for entering and exiting
//       trades.
//    2. Do not trade with money you cannot afford to lose.
//    3. I do not guarantee consistent profits or that anyone can make money with no
//       effort. And I am not selling the holy grail.
//    4. Every system can have winning and losing streaks.
//    5. Money management plays a large role in the results of your trading. For
//       example: lot size, account size, broker leverage, and broker margin call
//       rules all have an effect on results. Also, your Take Profit and Stop Loss
//       settings for individual pair trades and for overall account equity have a
//       major impact on results. If you are new to trading and do not understand
//       these items, then I recommend you seek education materials to further your
//       knowledge.
//
//    YOU NEED TO FIND AND USE THE TRADING SYSTEM THAT WORKS BEST FOR YOU AND YOUR
//    TRADING TOLERANCE.
//
//    I HAVE PROVIDED NOTHING MORE THAN A TOOL WITH OPTIONS FOR YOU TO TRADE WITH THIS PROGRAM ON TRADINGVIEW.
//
//    I accept suggestions to improve the script.
//    If you encounter any problems I will be happy to share with me.
//  -----------------------------------------------------------------------------
//
// ▒▒▒▒▒▒▒▒▒▒▒▒▒▒▒▒▒▒▒▒▒▒▒▒▒▒▒▒▒▒▒▒▒▒▒▒▒▒▒▒▒▒▒▒▒▒▒▒▒▒▒▒▒▒▒▒▒▒▒▒▒▒▒▒▒▒▒▒▒▒▒▒▒▒▒▒▒▒▒▒▒▒▒▒▒▒▒▒▒▒▒▒▒▒▒▒▒▒▒▒▒▒▒▒▒▒▒▒▒▒▒▒▒▒
// SETUP ============================================================================================================

strategy(title = 'Trailing Sell',
         shorttitle = 'TS',
         overlay = true,
         pyramiding = 0,
         default_qty_type = strategy.percent_of_equity,
         default_qty_value = 100,
         initial_capital = 100000)

//
// ▒▒▒▒▒▒▒▒▒▒▒▒▒▒▒▒▒▒▒▒▒▒▒▒▒▒▒▒▒▒▒▒▒▒▒▒▒▒▒▒▒▒▒▒▒▒▒▒▒▒▒▒▒▒▒▒▒▒▒▒▒▒▒▒▒▒▒▒▒▒▒▒▒▒▒▒▒▒▒▒▒▒▒▒▒▒▒▒▒▒▒▒▒▒▒▒▒▒▒▒▒▒▒▒▒▒▒▒▒▒▒▒▒▒
// FILTERS ==========================================================================================================

// INPUT ============================================================================================================
usefromDate = input.bool(defval = true, title = 'From', inline = "From Date", group = "Filters")
fromDate = input(defval = timestamp('01 Jan 2021 00:00 UTC'), title = '', inline = "From Date", group = 'Filters')
usetoDate = input.bool(defval = false, title = 'To ', inline = "To Date", group = "Filters")
toDate = input(defval = timestamp('31 Dec 2121 23:59 UTC'), title = '', inline = "To Date", group = 'Filters')

// LOGIC ============================================================================================================
isWithinPeriod() => true // create function "within window of time"

// PLOT =============================================================================================================
bgcolor(color = isWithinPeriod() ? color.new(color.gray, 90) : na, title = 'Period')

//
// ▒▒▒▒▒▒▒▒▒▒▒▒▒▒▒▒▒▒▒▒▒▒▒▒▒▒▒▒▒▒▒▒▒▒▒▒▒▒▒▒▒▒▒▒▒▒▒▒▒▒▒▒▒▒▒▒▒▒▒▒▒▒▒▒▒▒▒▒▒▒▒▒▒▒▒▒▒▒▒▒▒▒▒▒▒▒▒▒▒▒▒▒▒▒▒▒▒▒▒▒▒▒▒▒▒▒▒▒▒▒▒▒▒▒
// STRATEGY =========================================================================================================

// INPUT ============================================================================================================
fastMALen = input.int(defval = 21, title = 'Fast/Slow SMA Length', inline = 'MA Length', group = 'Strategy')
slowMALen = input.int(defval = 49, title = '', tooltip = 'How many candles back to calculte the fast/slow SMA.', inline = 'MA Length', group = 'Strategy')

// LOGIC ============================================================================================================
fastMA = ta.sma(close, fastMALen)
slowMA = ta.sma(close, slowMALen)

bool openLongPosition = isWithinPeriod() and ta.crossover(fastMA, slowMA)
bool closeLongPosition = ta.crossunder(fastMA, slowMA)

// PLOT =============================================================================================================
var fastColor = color.new(#0056BD, 0)
plot(series = fastMA, title = 'Fast SMA', color = fastColor, linewidth = 1, style = plot.style_line)
var slowColor = color.new(#FF6A00, 0)
plot(series = slowMA, title = 'Slow SMA', color = slowColor, linewidth = 1, style = plot.style_line)

plotshape(series = closeLongPosition and strategy.position_size > 0 ? fastMA : na, title = 'Sell', text = 'Sell', style = shape.labeldown, location = location.absolute, color = color.new(color.red, 0), textcolor = color.new(color.white, 0), size = size.tiny)

//
// ▒▒▒▒▒▒▒▒▒▒▒▒▒▒▒▒▒▒▒▒▒▒▒▒▒▒▒▒▒▒▒▒▒▒▒▒▒▒▒▒▒▒▒▒▒▒▒▒▒▒▒▒▒▒▒▒▒▒▒▒▒▒▒▒▒▒▒▒▒▒▒▒▒▒▒▒▒▒▒▒▒▒▒▒▒▒▒▒▒▒▒▒▒▒▒▒▒▒▒▒▒▒▒▒▒▒▒▒▒▒▒▒▒▒
// EXIT ============================================================================================================

// INPUT ============================================================================================================
enableTrailing = input.bool(defval = true, title = 'Enable Trailing', tooltip = 'Enable or disable the trailing for exit position.', group = 'Exit')
devExitPerc = input.float(defval = 3.0, title = 'Deviation %', minval = 0.01, maxval = 100, step = 0.05, tooltip = 'The step to follow the price when the open position condition is met.', group = 'Exit') / 100
ctrLongExitSrc = input.source(defval = low, title = 'Source Exit Control', tooltip = 'The source price to compare with the exit price to trigger the exit order when trailing.', group = 'Exit')

// LOGIC ============================================================================================================
var bool exitLongPosition = false

int barsSinceOpenLong = nz(ta.barssince(openLongPosition), 999999)
int barsSinceCloseLong = nz(ta.barssince(closeLongPosition), 999999)
int barsSinceExitLong = nz(ta.barssince(exitLongPosition), 999999)
bool closeLongIsActive = barsSinceOpenLong >= barsSinceCloseLong
bool exitLongIsPending = barsSinceExitLong >= barsSinceCloseLong
bool tryExitLongPosition = isWithinPeriod() and closeLongIsActive and exitLongIsPending

float longExitPrice = na
longExitPrice := if closeLongPosition and strategy.position_size > 0
    close * (1 - devExitPerc)
else if tryExitLongPosition
    math.max(high * (1 - devExitPerc), nz(longExitPrice[1], 999999))
else
    na

exitLongPosition := enableTrailing ? isWithinPeriod() and ta.crossunder(closeLongPosition ? close : ctrLongExitSrc, longExitPrice) : closeLongPosition

// PLOT =============================================================================================================
var sellPriceColor = color.new(#e25141, 0)
plot(series = enableTrailing ? longExitPrice : na, title = 'Long Sell Price', color = sellPriceColor, linewidth = 1, style = plot.style_linebr)

//
// ▒▒▒▒▒▒▒▒▒▒▒▒▒▒▒▒▒▒▒▒▒▒▒▒▒▒▒▒▒▒▒▒▒▒▒▒▒▒▒▒▒▒▒▒▒▒▒▒▒▒▒▒▒▒▒▒▒▒▒▒▒▒▒▒▒▒▒▒▒▒▒▒▒▒▒▒▒▒▒▒▒▒▒▒▒▒▒▒▒▒▒▒▒▒▒▒▒▒▒▒▒▒▒▒▒▒▒▒▒▒▒▒▒▒
// POSITION ORDERS ==================================================================================================

// LOGIC ============================================================================================================
// getting into LONG position
strategy.entry(id = 'Long Entry', direction = strategy.long, when = openLongPosition, alert_message = 'Long(' + syminfo.ticker + '): Started')
// submit close order on trend reversal
strategy.close(id = 'Long Entry', when = exitLongPosition, comment = 'Close Long', alert_message = 'Long(' + syminfo.ticker + '): Closed at market price')

// PLOT =============================================================================================================
var posColor = color.new(color.white, 0)
plot(series = strategy.position_avg_price, title = 'Position', color = posColor, linewidth = 1, style = plot.style_linebr)

// ==================================================================================================================