Strategi Stop Loss Trailing ATR Bohr Band
Ringkasan
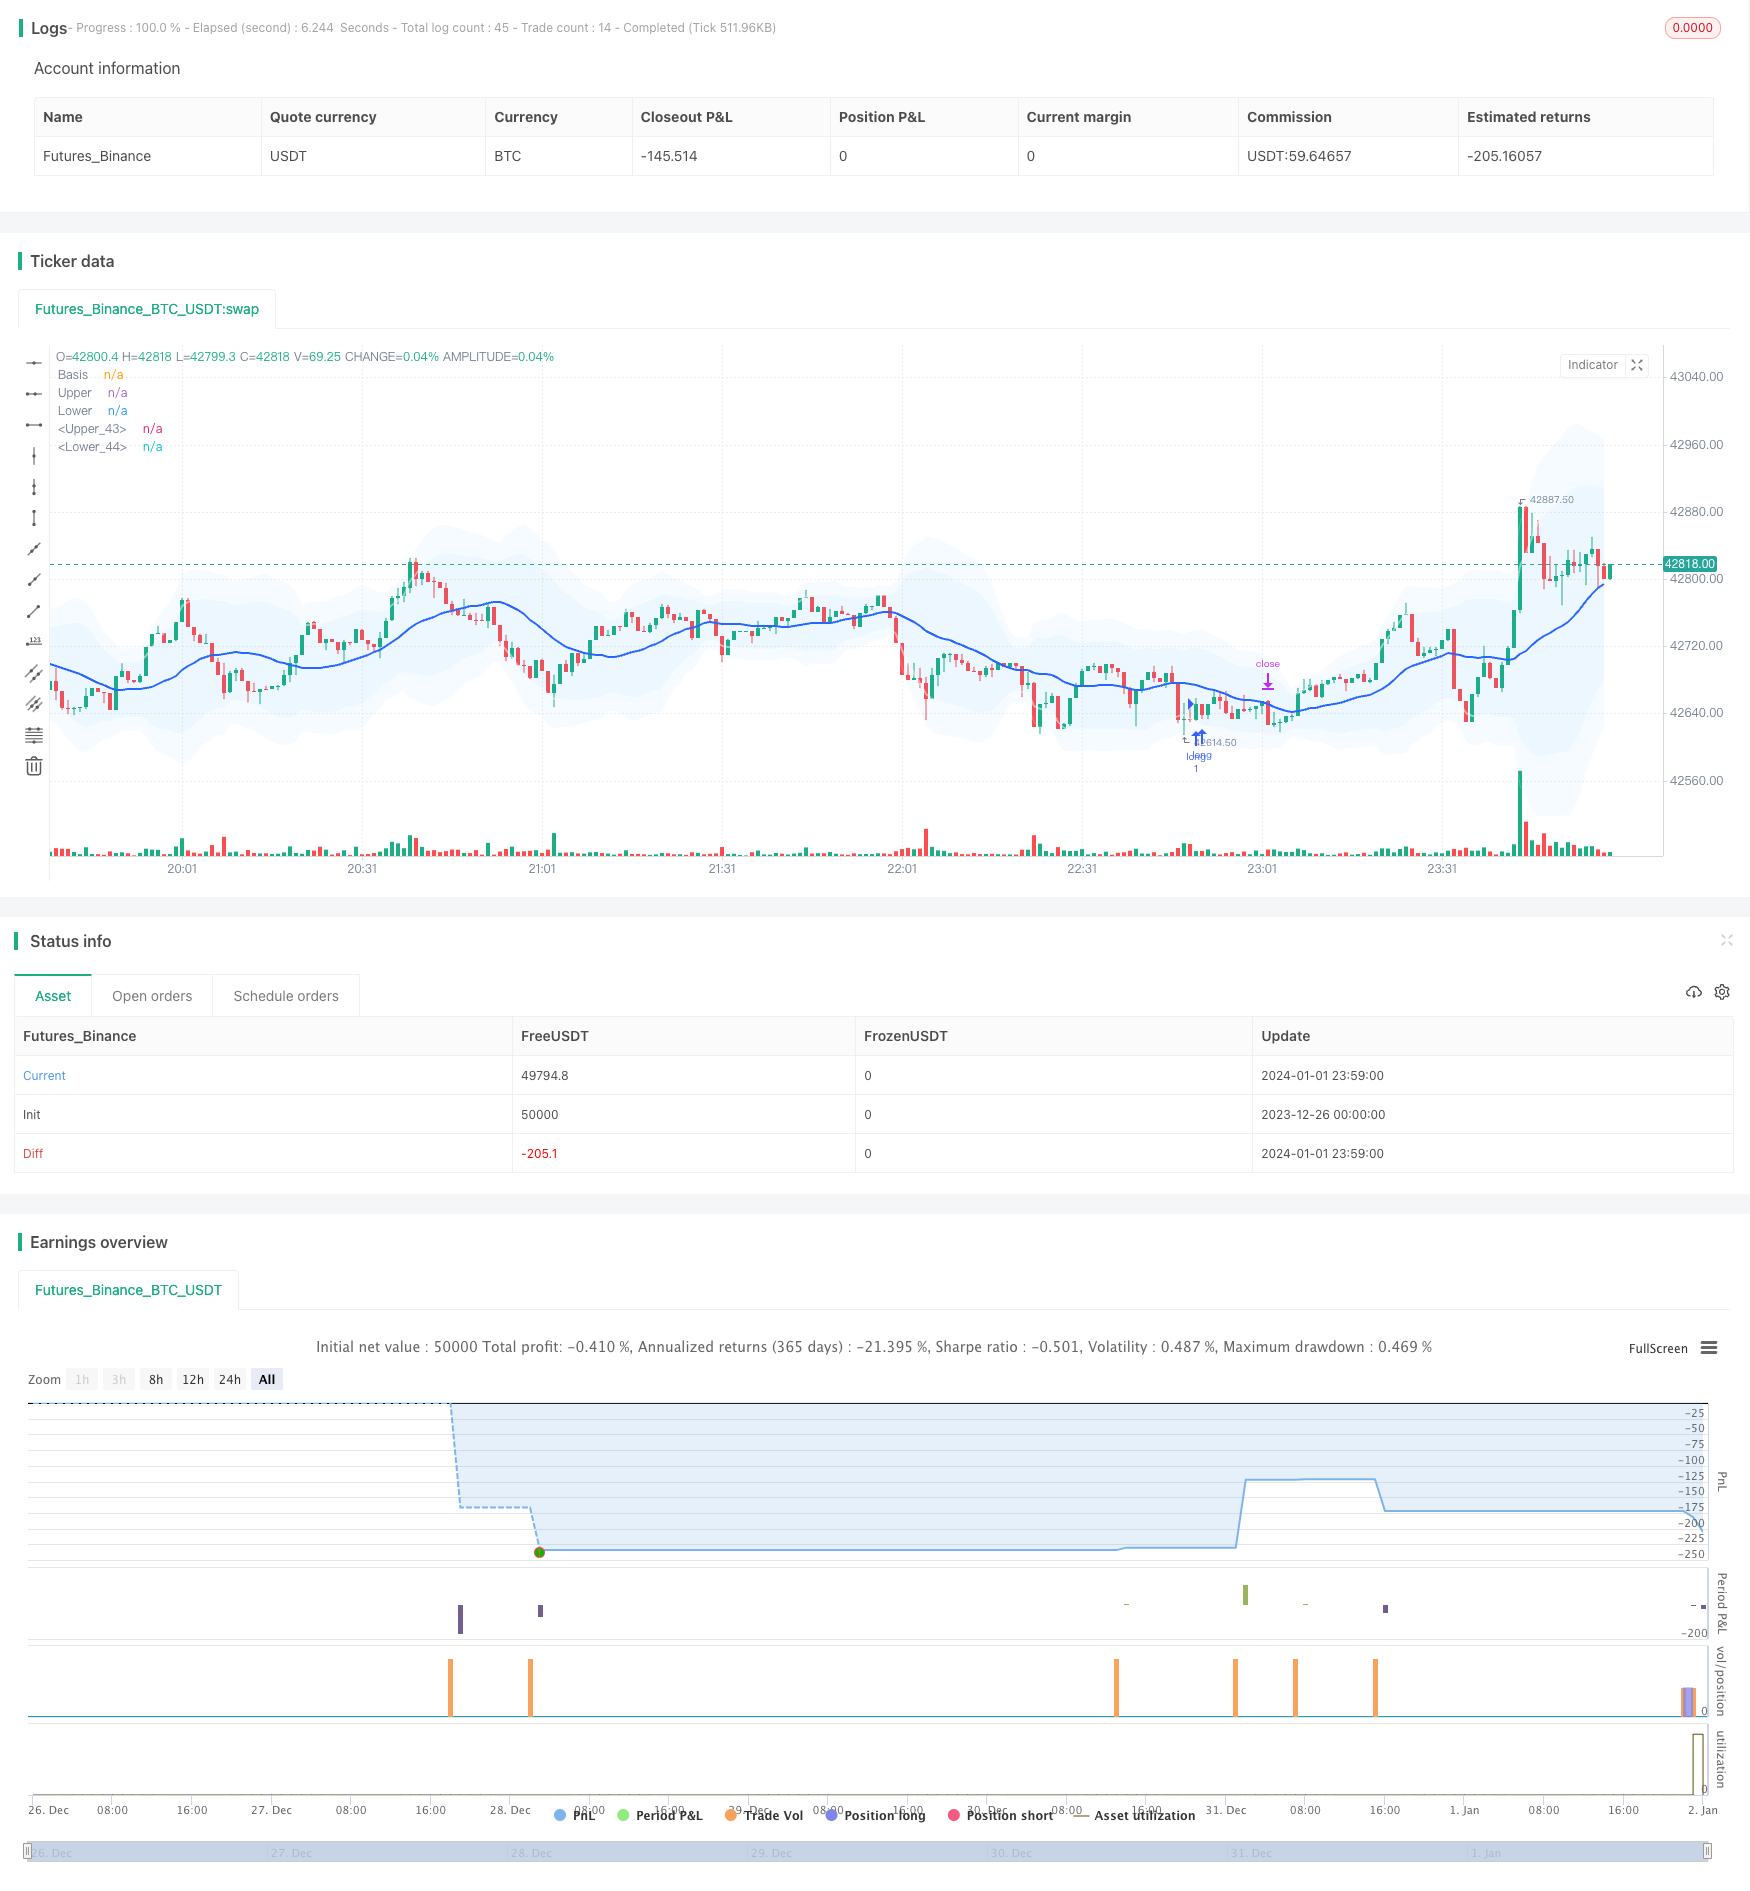
Strategi ini menggabungkan penggunaan indikator Bol band dan indikator Average True Range (ATR) untuk membentuk strategi perdagangan terobosan dengan fungsi stop loss yang diikuti. Sinyal perdagangan dikirim ketika harga naik atau turun melalui Bol band dengan standar yang ditentukan.
Prinsip Strategi
Langkah pertama, menghitung garis tengah, garis atas dan garis bawah. Garis tengah adalah harga SMA sederhana bergerak, garis atas dan bawah adalah harga beberapa kali lipat dari standar perbedaan. Ketika harga dari garis bawah menembus ke atas, lakukan lebih banyak; Ketika dari garis atas menembus ke bawah, lakukan kosong.
Langkah kedua, menghitung indikator ATR. Indikator ATR mencerminkan volatilitas rata-rata harga. Berdasarkan nilai ATR, atur stop loss untuk posisi panjang dan stop loss untuk posisi pendek.
Langkah ketiga, gunakan filter waktu, hanya berdagang pada periode waktu yang ditentukan, dan hindari fluktuasi besar dalam berita utama.
Langkah keempat, mekanisme trailing stop. Sesuai dengan posisi ATR terbaru, penyesuaian stop loss secara real time, untuk mengunci lebih banyak keuntungan.
Analisis Keunggulan
Indikator Bollinger Bands sendiri mencerminkan pusat harga, lebih efektif daripada satu rata-rata bergerak;
ATR Stop Loss membuat setiap rasio keuntungan dan kerugian dapat dikontrol, sehingga risiko dapat dikendalikan secara efektif.
Trailing stop dapat disesuaikan secara otomatis sesuai dengan fluktuasi pasar untuk mengunci lebih banyak keuntungan;
Berbagai parameter kebijakan, dan portofolio yang dapat disesuaikan.
Analisis risiko
Pada saat perubahan besar-besaran, kerugian kecil dapat terjadi berulang kali.
“Kembali ke masa lalu, mungkin tidak akan berhasil”, kata seorang blogger di New York Times.
Berbisnis di malam hari dan saat berita penting berisiko tinggi, jadi berhati-hatilah.
Tanggapan:
- Mematuhi prinsip-prinsip manajemen risiko yang ketat dan mengendalikan kerugian tunggal;
- Optimalkan parameter, tingkatkan kemenangan;
- Gunakan filter waktu untuk menghindari waktu-waktu yang berisiko tinggi.
Arah optimasi
- Uji konfigurasi optimasi dari kombinasi parameter yang berbeda
- Menambahkan indikator panas seperti OBV saat dipilih
- Menambahkan optimasi modul pembelajaran mesin
Meringkaskan
Strategi ini menggunakan indikator bolus untuk menentukan arah tengah dan arah terobosan, indikator ATR untuk menghitung stop loss untuk menjamin keuntungan dan kerugian, dan stop loss untuk mengunci keuntungan. Keuntungan dari strategi ini adalah sangat dapat disesuaikan, dapat dikontrol risiko, dan cocok untuk perdagangan Intraday. Optimasi parameter dan pembelajaran mesin dapat meningkatkan peluang strategi dan keuntungan.
/*backtest
start: 2023-12-26 00:00:00
end: 2024-01-02 00:00:00
period: 1m
basePeriod: 1m
exchanges: [{"eid":"Futures_Binance","currency":"BTC_USDT"}]
*/

// This source code is subject to the terms of the Mozilla Public License 2.0 at https://mozilla.org/MPL/2.0/
// © sadeq_haddadi

//@version=5

strategy('Bollinger Bands + ATR / trail- V2', overlay=true ) // Interactive Brokers rate)


//date and time
startDate   = input(title="Start Date", defval=timestamp("01 Aug 2023 00:00 +0000"), tooltip="Date & time to begin analysis",group = 'Time Filter')
endDate     = input(title="End Date", defval=timestamp("1 Jan 2099 00:00 +0000"), tooltip="Date & time to stop analysis")
timeSession = input(title="Time Session To Analyze", defval="0300-1700", tooltip="Time session to analyze")
inSession(sess) => true

// indicators

length = input.int(20, minval=1,group = 'Bollinger Band')
maType = input.string("SMA", "Basis MA Type", options = ["SMA", "EMA", "SMMA (RMA)", "WMA", "VWMA"])
src = input(close, title="Source")
mult1 = input.float(2.0, minval=0.001, maxval=50, title="StdDev1")
mult2 = input.float(3.0, minval=0.001, maxval=50, title="StdDev2")

ma(source, length, _type) =>
    switch _type
        "SMA" => ta.sma(source, length)
        "EMA" => ta.ema(source, length)
        "SMMA (RMA)" => ta.rma(source, length)
        "WMA" => ta.wma(source, length)
        "VWMA" => ta.vwma(source, length)

basis = ma(src, length, maType)
dev1 = mult1 * ta.stdev(src, length)
dev2 = mult2 * ta.stdev(src, length)
upper1 = basis + dev1
lower1 = basis - dev1
upper2 = basis + dev2
lower2 = basis - dev2
offset = input.int(0, "Offset", minval = -500, maxval = 500)
plot(basis, "Basis", color=#2962FF, offset = offset,linewidth=2)
p1 = plot(upper1, "Upper", color=color.new(color.white,50), offset = offset,linewidth=2)
p2 = plot(lower1, "Lower", color=color.new(color.white,50), offset = offset,linewidth=2)
p3 = plot(upper2, "Upper", color=color.new(color.white,80), offset = offset,linewidth=1)
p4 = plot(lower2, "Lower", color=color.new(color.white,80), offset = offset,linewidth=1)

fill(p1, p2, title = "Background", color=color.rgb(33, 150, 243, 95))
fill(p3, p4, title = "Background", color=color.rgb(33, 150, 243, 95))

show_crosses = input(false, "Show Cross the Bands?")

plotshape(show_crosses and ta.crossover(close, upper2)  ? src : na, "S", style = shape.triangledown, location =location.abovebar, color = color.yellow, size = size.tiny)
plotshape(show_crosses and ta.crossunder(low, lower2) ? src : na ,"L", style = shape.triangleup, location =  location.belowbar, color = color.purple, size = size.tiny)

second_entry = input(true, "Show second deviation entry point?")

//atr

length_ATR = input.int(title="Length", defval=5, minval=1,group = 'ATR')
smoothing = input.string(title="Smoothing", defval="RMA", options=["RMA", "SMA", "EMA", "WMA"])
m = input.float(1, "Multiplier")
src1 = input(high)
src2 = input(low)
pline = input.bool(title = 'show ATR lines ?', defval=false)


ma_function(source, length_ATR) =>
	if smoothing == "RMA"
		ta.rma(source, length_ATR)
	else
		if smoothing == "SMA"
			ta.sma(source, length_ATR)
		else
			if smoothing == "EMA"
				ta.ema(source, length_ATR)
			else
				ta.wma(source, length_ATR)

a = ma_function(ta.tr(true), length_ATR) * m
x = ma_function(ta.tr(true), length_ATR) * m + src1
x2 = src2 - ma_function(ta.tr(true), length_ATR) * m

PP1 = plot(pline ? x :na , title = "ATR Short Stop Loss", color= color.new(color.red,20) )
PP2 = plot(pline ? x2:na , title = "ATR Long Stop Loss",  color=color.new(color.green,20) )

Tp_to_Sl = input.float(1.5, "TP/SL")
candle_size =  input.float(10, "candle/pip")
distance_source =  input.float(1.5, "distance to midline/pip")
//strategy

buyCondition = low[2] < lower1 and  ta.crossover(close[1], lower1)  and strategy.position_size == 0 and (close[1] - open[1]) < candle_size * 0.0001 and close > open and ( basis - close) > distance_source * 0.0001

sellCondition = high[2] > upper1 and ta.crossunder(close[1], upper1)  and strategy.position_size == 0 and (open[1] - close[1]) < candle_size * 0.0001 and close < open  and (close - basis) > distance_source * 0.0001
//
buyCondition2 = low[2] < lower2 and  ta.crossover(close[1], lower2)  and (close[1] - open[1]) < candle_size * 0.0001 and close > open and ( basis - close) > distance_source * 0.0001
sellCondition2 = high[2] > upper2 and ta.crossunder(close[1], upper2)   and (open[1] - close[1]) < candle_size * 0.0001 and close < open  and (close - basis) > distance_source * 0.0001

plotshape(second_entry and  sellCondition2 ? src : na, "S", style = shape.triangledown, location =location.abovebar, color = color.rgb(241, 153, 177), size = size.tiny)
plotshape(second_entry and buyCondition2 ? src : na ,"L", style = shape.triangleup, location =  location.belowbar, color = color.rgb(177, 230, 168), size = size.tiny)
//
since_buy  =ta.barssince(buyCondition)
since_sell =ta.barssince(sellCondition)
entry_price = ta.valuewhen(buyCondition or sellCondition, src, 0)

sl_long = ta.valuewhen(buyCondition, x2[1], 0)
sl_short = ta.valuewhen(sellCondition, x[1], 0)
buyprofit = entry_price + (Tp_to_Sl*( entry_price - sl_long))
sellprofit= entry_price + (Tp_to_Sl*( entry_price - sl_short))

//alert_massage = "new strategy position is {{strategy.position_size}}"
//prof = ta.crossover(high,upper1)
//buyexit=ta.valuewhen(prof,upper1,0)

if buyCondition and inSession(timeSession)

    strategy.entry( id = "long", direction = strategy.long , alert_message='Open Long Position' )

if sellCondition and inSession(timeSession)

    strategy.entry(id= "short", direction = strategy.short, alert_message='Open Short Position')

//trail-stop loss
use_trailing = input.bool(title = 'use trailing stop loss?', defval=true)
pricestop_long=0.00
pricestop_short=100000.00
if (strategy.position_size > 0)

    if use_trailing == false
        pricestop_long := sl_long
    else
        pricestop_long := math.max (x2, pricestop_long[1]) //trail - long

if (strategy.position_size < 0)

    if use_trailing == false
        pricestop_short := sl_short
    else
        pricestop_short := math.min (x, pricestop_short[1])  // trail - short

if strategy.position_size > 0

    strategy.exit(id = 'close', limit =  buyprofit , stop = pricestop_long  )

if strategy.position_size < 0

    strategy.exit(id = 'close', limit = sellprofit  , stop = pricestop_short  )

alertcondition(buyCondition or sellCondition, 'Enter_position')