TrendSurfing - Strategi Tren Crossover Rata-rata Pergerakan Ganda
Ringkasan
Strategi TrendSurfing adalah strategi pelacakan tren dengan sinyal perdagangan utama yang dipenuhi oleh dua garis sejajar. Ini menggabungkan indikator visual segitiga, 200-hari EMA, indikator ROC, dan indikator RSI untuk menyaring kebisingan dan menangkap arah tren baru dengan tepat pada titik-titik perubahan tren.
Prinsip Strategi
Strategi TrendSurfing terutama didasarkan pada rata-rata bergerak cepat dan rata-rata bergerak lambat untuk membentuk sinyal beli dan jual. Sinyal beli dihasilkan ketika rata-rata bergerak cepat melewati rata-rata bergerak lambat; Sinyal jual dihasilkan ketika rata-rata bergerak lambat melewati rata-rata bergerak cepat.
Selain itu, strategi ini juga memperkenalkan beberapa indikator tambahan untuk memfilter sinyal palsu atau menentukan kualitas tren.
- Indikator ROC menilai tren dan kecepatan perubahan harga
- Indeks RSI menilai apakah ada zona overbought atau oversold
- 200 hari EMA menilai arah tren keseluruhan
- Indikator visual segitiga yang menandai titik masuk pada grafik
Melalui penilaian komprehensif multi-indikator, strategi TrendSurfing dapat menentukan posisi tepat di titik-titik perubahan tren, melacak tren yang jelas di garis panjang, dan menghindari gangguan dari kebisingan pasar atau penyesuaian garis pendek.
Analisis Keunggulan
1. Menangkap tren yang jelas
Strategi ini menggunakan garis rata-rata untuk menyeberangi titik-titik perubahan tren, dengan indikator seperti 200-day EMA yang memfilter kebisingan garis pendek, dan fokus pada garis tengah yang lebih panjang.
2. Kombinasi multi-indikator yang mengkonfirmasi waktu masuk yang berkualitas tinggi
Selain crossover rata-rata itu sendiri, strategi ini juga memperkenalkan indikator seperti ROC, RSI, dan lain-lain untuk menghindari zona getaran pada titik-titik perubahan tren untuk memastikan kualitas masuk.
3. Indikator visual segitiga yang mudah dibaca
Segitiga ke bawah berwarna hijau menandai waktu pembelian, segitiga ke atas berwarna merah menandai waktu penjualan, dan itu sudah jelas.
4. Parameter yang dapat disesuaikan untuk memenuhi kebutuhan yang berbeda
Pengguna dapat secara bebas menyesuaikan parameter garis rata-rata, panjang ROC, panjang RSI, dan lain-lain sesuai dengan gaya perdagangan mereka.
5. Mengambil alih manajemen stop loss Strategi ini menggunakan nilai ATR kali rasio risiko sebagai stop loss dan stop loss, untuk mengendalikan risiko transaksi tunggal.
Analisis risiko
1. Resiko Ketidakpastian
Setiap strategi yang didasarkan pada persimpangan garis rata akan menghadapi risiko kehilangan atau risiko stop loss yang ditimbulkan ketika garis rata bergoyang.
2. Setting parameter yang tidak tepat dapat menyebabkan over-optimisasi
Pengguna harus menghindari mengejar parameter standar, dan menetapkan nilai indikator yang terlalu ideal. Parameter harus diuji sesuai dengan kondisi pasar dan varietas yang berbeda.
3. Ketidakmampuan untuk memfilter secara menyeluruh kejadian risiko sistemik pasar Dalam kasus ekstrim seperti Black Swan, kerugian yang lebih besar masih bisa terjadi.
Arah optimasi
1. Mengatur parameter pengujian dan optimasi
Periode rata-rata, panjang ROC, parameter RSI, dan lain-lain harus diuji dan dioptimalkan agar lebih sesuai dengan karakteristik varietas perdagangan yang berbeda.
2. Pengujian dan pengenalan indikator tambahan
Anda dapat terus menguji efek kombinasi dari indikator lain seperti BOLL, KDJ dan lain-lain dengan garis rata-rata.
3. Optimalisasi Stop Loss dengan Trading Algorithmic
Menggunakan algoritma pembelajaran mesin untuk membuat stop loss lebih cerdas dan beradaptasi dengan perubahan lingkungan pasar yang dinamis.
4. Menjelajahi kombinasi dengan strategi atau model lain
Kombinasi dengan strategi pilihan saham dasar, strategi statistical arbitrage, model optimasi portofolio, dan lain-lain, dapat lebih mengontrol risiko dan meningkatkan tingkat keuntungan.
Meringkaskan
Strategi TrendSurfing adalah strategi pelacakan tren yang sederhana, langsung, dan dapat dikontrol risiko. Strategi ini dikembangkan di sekitar sinyal perdagangan yang terbentuk dari persilangan dua garis ekuivalen dan disaring dengan berbagai indikator tambahan. Strategi ini cocok untuk memegang posisi garis panjang dan menengah, yang dapat menstabilkan tren pasar banteng.
||
Overview
The TrendSurfing strategy is a trend tracking strategy based primarily on double moving average crossover signals. It also incorporates triangle visual indicators, 200-day EMA, ROC indicator and RSI indicator to filter out noise and accurately capture trend reversals. This strategy is suitable for medium-to-long-term holding and can achieve steady growth in a bull market.
Strategy Logic
The TrendSurfing strategy mainly relies on golden cross and death cross formed by fast moving average and slow moving average to generate buy and sell signals. When the fast MA crosses above the slow MA, a buy signal is generated. When the fast MA crosses below the slow MA, a sell signal is generated.
In addition, the strategy incorporates several auxiliary indicators to filter out false signals or determine trend quality, including:
- ROC indicator to determine price trend and momentum
- RSI oscillator to detect overbought/oversold levels
- 200-day EMA to determine overall trend direction
- Triangle visual indicators to mark entry points on chart
By comprehensively judging various indicators, the TrendSurfing strategy can accurately locate trend turning points and track definite medium-to-long term trends without being misguided by market noise or short-term corrections.
Advantage Analysis
1. Catch Medium-to-Long Term Trend
The strategy basically judges trend reversal based on MA crosses, and uses indicators like 200-day EMA to filter out short-term noise, with focus on medium-to-long term trend capture.
2. Multiple Indicators Ensure High Quality Entry
On top of MA crossover itself, the incorporation of ROC, RSI and other indicators enables avoidance of consolidation zones on reversal points and ensures quality entry.
3. Intuitive Triangle Visual Indicators
Green downward triangles indicate long entries, red upward triangles indicate short entries. Clean and straightforward.
4. Customizable Parameters for Different Needs
Users can freely adjust parameters like MA periods, ROC length, RSI length etc according to their own trading style.
5. Stop Loss and Take Profit Control
The strategy sets stop loss and take profit based on ATR value multiplied by risk percentage, enabling per trade risk control.
Risk Analysis
1. Risk of Missing Trades
Any MA crossover based strategy has inherent risk of missing trades or being stopped out when MA is oscillating.
2. Over-optimization from Improper Parameter Settings Users should avoid chasing hypothetically ideal parameter values. Parameters should be tested and adapted based on different market conditions and products.
3. Inability to Fully Filter Black Swan Events
Under extreme market conditions, strategies could still face large losses from market systemic risks.
Optimization Directions
1. Test and Optimize Parameter Values
Periods of MAs, length of ROC, values of RSI etc should go through rigorous backtesting and optimization to fit characteristics of different trading products.
2. Test and Incorporate Other Auxiliary Indicators
Continue testing combinations of other indicators like BOLL, KDJ etc with MA crosses for better performance.
3. Coordinate with Algorithmic Trading for Better Risk Control Introduce machine learning algorithms to enable more intelligent stop loss and take profit, adapting to dynamic market environments.
4. Explore Combinations with Other Strategies or Models
Combining with fundamentals-based stock picking strategies, statistical arbitrage strategies, portfolio optimization models etc could further enhance risk control and return.
Conclusion
The TrendSurfing strategy is a simple, straightforward trend tracking strategy with controllable risk. Trading signals are generated from MA crosses and filtered by multiple auxiliary indicators. It is suitable for medium-to-long term holding to steadily track bull market trends. We will continue optimizing this strategy through parameter testing, indicator expansion, risk control etc to achieve more reliable performance across diverse markets.
[/trans]
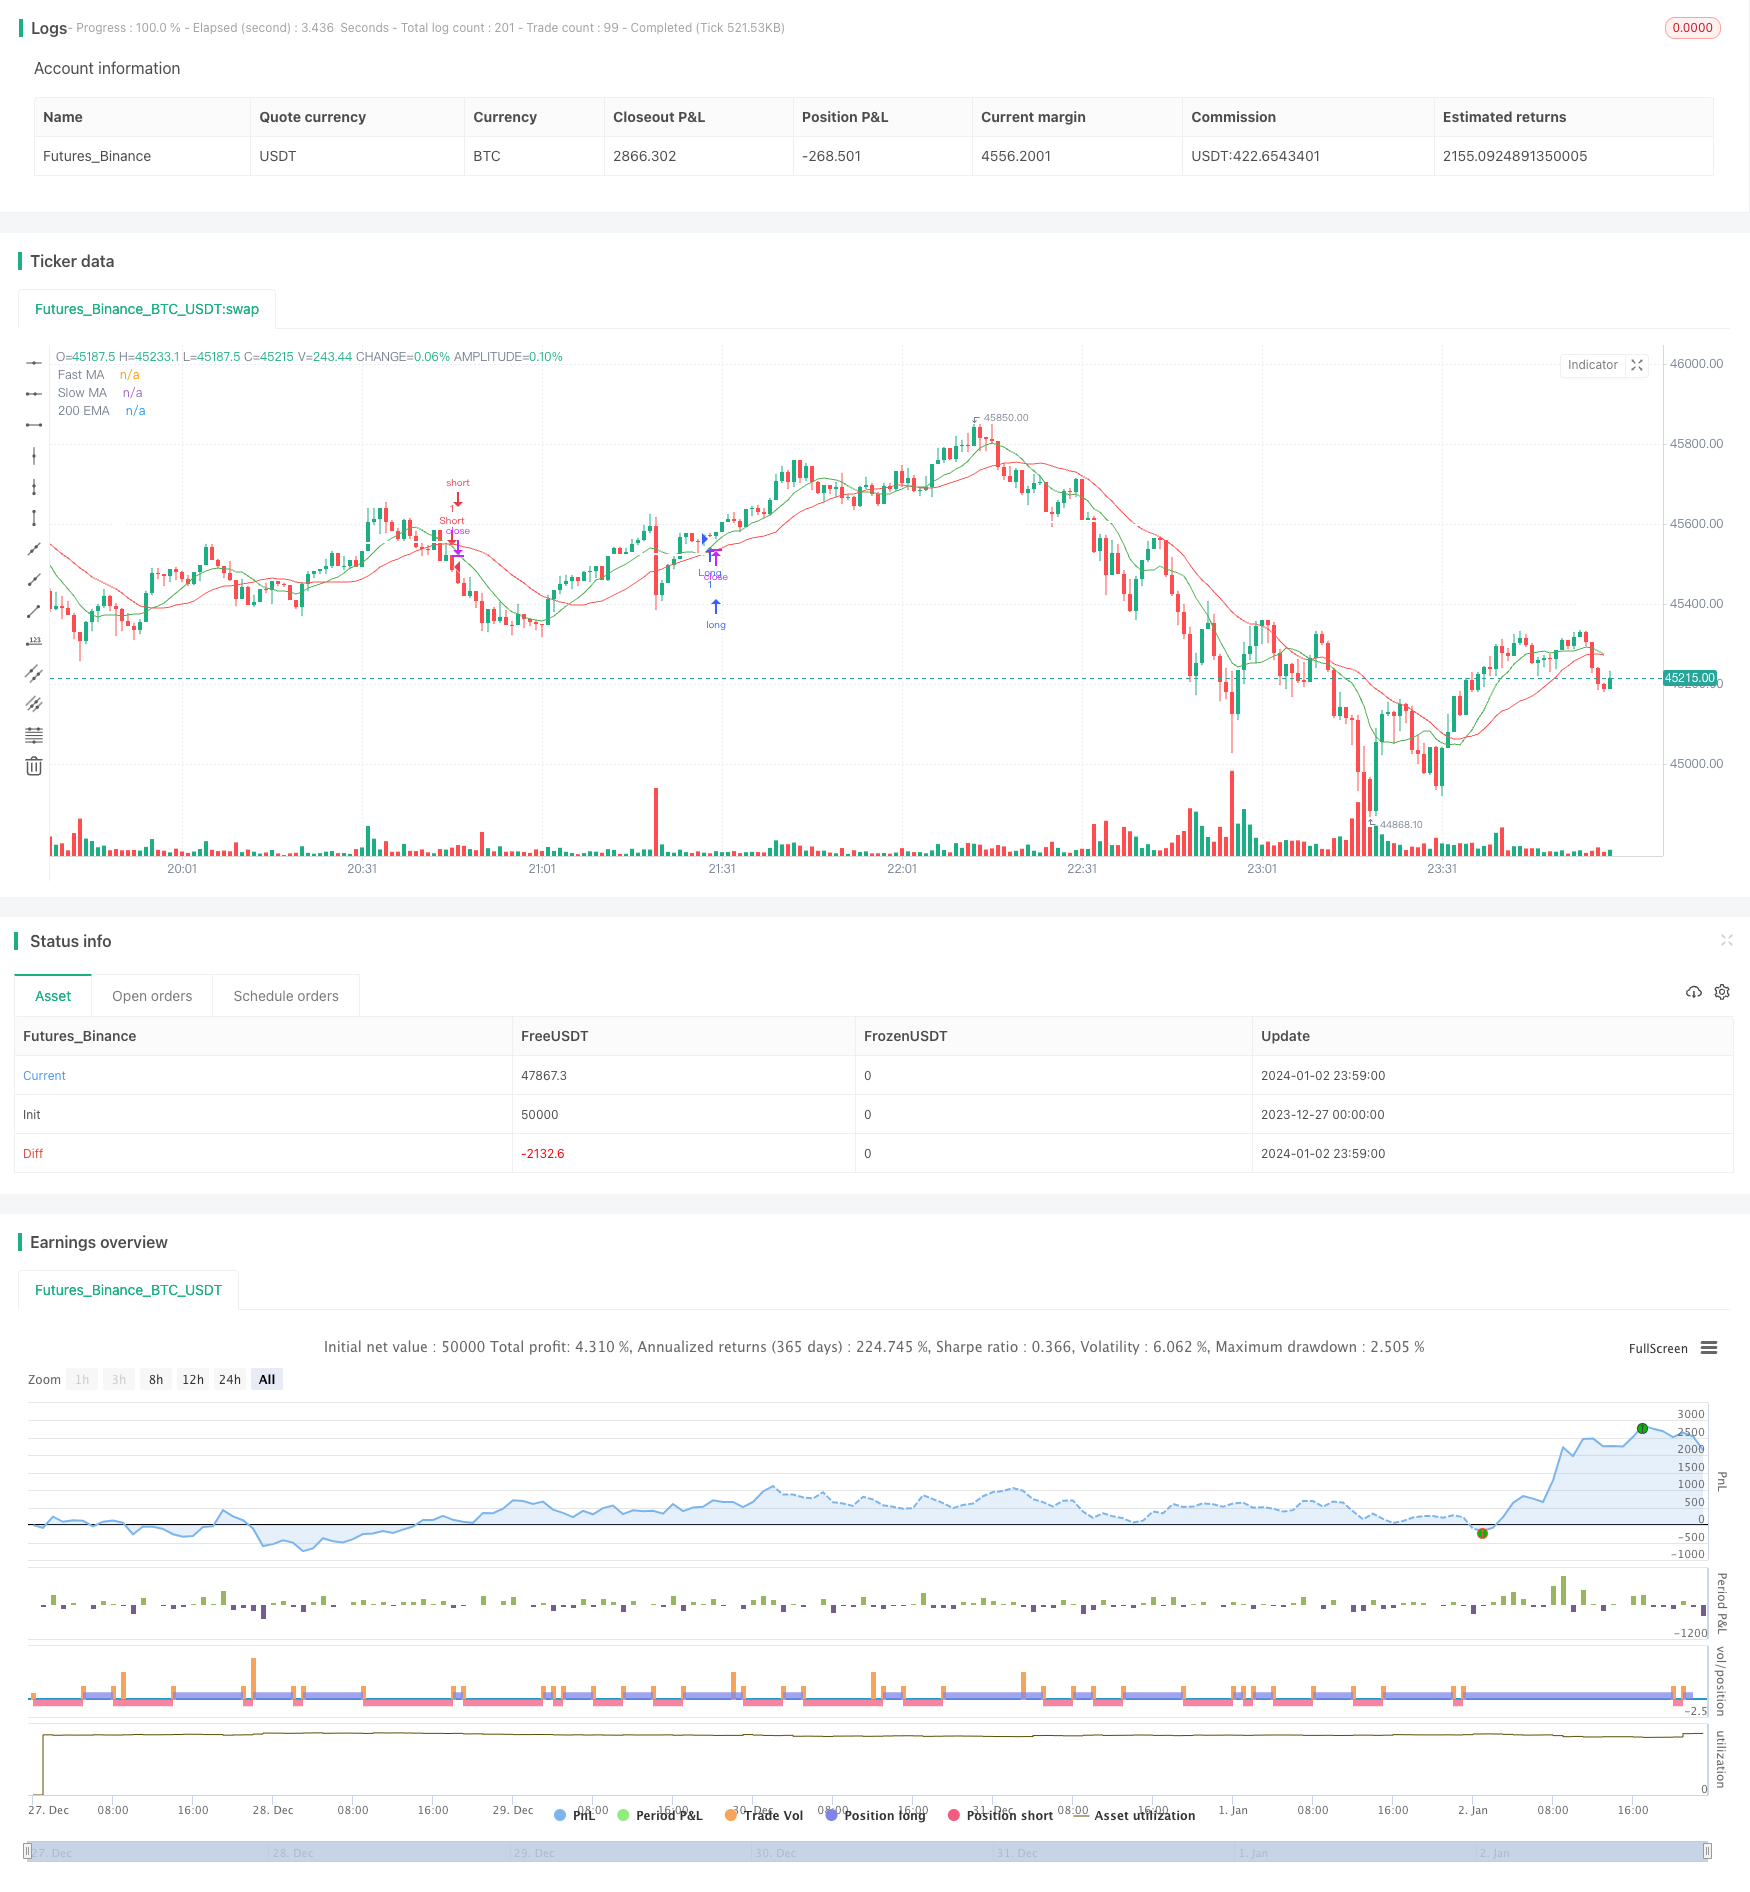
/*backtest
start: 2023-12-27 00:00:00
end: 2024-01-03 00:00:00
period: 1m
basePeriod: 1m
exchanges: [{"eid":"Futures_Binance","currency":"BTC_USDT"}]
*/

//@version=4
strategy("Moving Average Crossover with Triangles, 200 EMA, ROC, and RSI", overlay=true)

// Define input parameters
fast_length = input(9, title="Fast MA Length")
slow_length = input(21, title="Slow MA Length")
roc_length = input(14, title="ROC Length")
rsi_length = input(14, title="RSI Length")

// Calculate moving averages
fast_ma = sma(close, fast_length)
slow_ma = sma(close, slow_length)

// Plot moving averages
plot(fast_ma, color=color.green, title="Fast MA")
plot(slow_ma, color=color.red, title="Slow MA")

// Plot 200 EMA
ema_200 = ema(close, 200)
plot(ema_200, color=color.white, title="200 EMA", linewidth=2)

// Calculate Rate of Change (ROC)
roc = roc(close, roc_length)

// Calculate RSI
rsi = rsi(close, rsi_length)

// Define strategy entry and exit conditions
long_condition = crossover(fast_ma, slow_ma) and roc > 0 and close > ema_200 and rsi > 55
short_condition = crossunder(fast_ma, slow_ma) and roc < 0 and close < ema_200 and rsi < 45

// Execute strategy
strategy.entry("Long", strategy.long, when=long_condition)
strategy.entry("Short", strategy.short, when=short_condition)

// Define stop loss and take profit levels
risk_percent = input(1, title="Risk Percentage", minval=0.1, maxval=5, step=0.1) / 100
atr_value = atr(14)
stop_loss = close - atr_value * risk_percent
take_profit = close + atr_value * risk_percent

strategy.exit("Take Profit/Stop Loss", from_entry="Long", loss=stop_loss, profit=take_profit)
strategy.exit("Take Profit/Stop Loss", from_entry="Short", loss=stop_loss, profit=take_profit)

// Plot larger triangles on crossover and crossunder
plotshape(series=long_condition, title="Long Entry", color=color.green, style=shape.triangleup, location=location.belowbar, size=size.small)
plotshape(series=short_condition, title="Short Entry", color=color.red, style=shape.triangledown, location=location.abovebar, size=size.small)