Strategi Sinyal Crossover Rata-rata Bergerak
Tanggal Pembuatan:
2024-01-08 15:54:32
Akhirnya memodifikasi:
2024-01-08 15:54:32
menyalin:
0
Jumlah klik:
799
1
fokus pada
1750
Pengikut
Ringkasan
Strategi ini memungkinkan sinyal crossover antara moving averages dengan menghitung dan memetakan berbagai jenis moving averages, yang digunakan untuk mengirim sinyal beli dan jual.
Prinsip Strategi
- Strategi memungkinkan untuk memilih berbagai jenis moving average, termasuk SMA, EMA, WMA, dan lain-lain.
- Strategi menghitung rata-rata bergerak utama, juga memungkinkan untuk memilih rata-rata bergerak kedua.
- Kebocoran pasar dinilai melalui persilangan antara rata-rata bergerak utama dan rata-rata bergerak kedua.
- Sebuah sinyal beli dihasilkan ketika rata-rata bergerak di atas rata-rata bergerak melewati periode yang ditentukan sendiri; sinyal jual dihasilkan ketika rata-rata bergerak di bawah rata-rata bergerak melewati periode yang ditentukan sendiri.
- Dengan cara ini, pasar yang kosong dapat dinilai dengan lebih jelas melalui persilangan rata-rata bergerak.
Keunggulan Strategis
- Jenis rata-rata bergerak dapat disesuaikan untuk memenuhi kebutuhan yang berbeda.
- Anda dapat menambahkan moving average kedua untuk membuat sinyal lebih jelas.
- Periode rata-rata bergerak yang dapat disesuaikan untuk periode waktu yang berbeda.
- Rendering warna yang dapat dihaluskan untuk membuat gambar lebih jelas.
- Dengan menggunakan mekanisme sinyal silang, status udara multi udara dapat dinilai secara akurat.
Risiko dan optimasi strategi
- Rata-rata bergerak memiliki keterlambatan, dan mungkin terjadi sinyal palsu. Anda dapat memilih kurva yang sesuai dengan rata-rata bergerak.
- Periode rata-rata bergerak yang tidak tepat dapat menyebabkan kehilangan peluang perdagangan. Anda dapat menguji lebih banyak kombinasi untuk mencari parameter terbaik.
- Disarankan untuk melakukan verifikasi dalam kombinasi dengan indikator lain, seperti volume energi perdagangan, untuk mengurangi risiko.
- Pertimbangkan untuk mengubah rata-rata bergerak dari sinyal yang diambil menjadi rata-rata curl, yang dapat meningkatkan akurasi sinyal.
- Optimasi strategi dapat dikombinasikan dengan model pembelajaran mendalam seperti LSTM.
Meringkaskan
Strategi ini secara keseluruhan memiliki ide yang jelas, menggunakan prinsip lintas rata-rata bergerak untuk menilai situasi pasar yang kosong, parameter dapat disesuaikan untuk memenuhi kebutuhan yang berbeda. Ada juga beberapa masalah, tetapi dapat ditingkatkan dengan mengoptimalkan model dan parameter. Secara keseluruhan, strategi ini adalah perwakilan khas dari strategi perdagangan berdasarkan rata-rata bergerak.
Kode Sumber Strategi
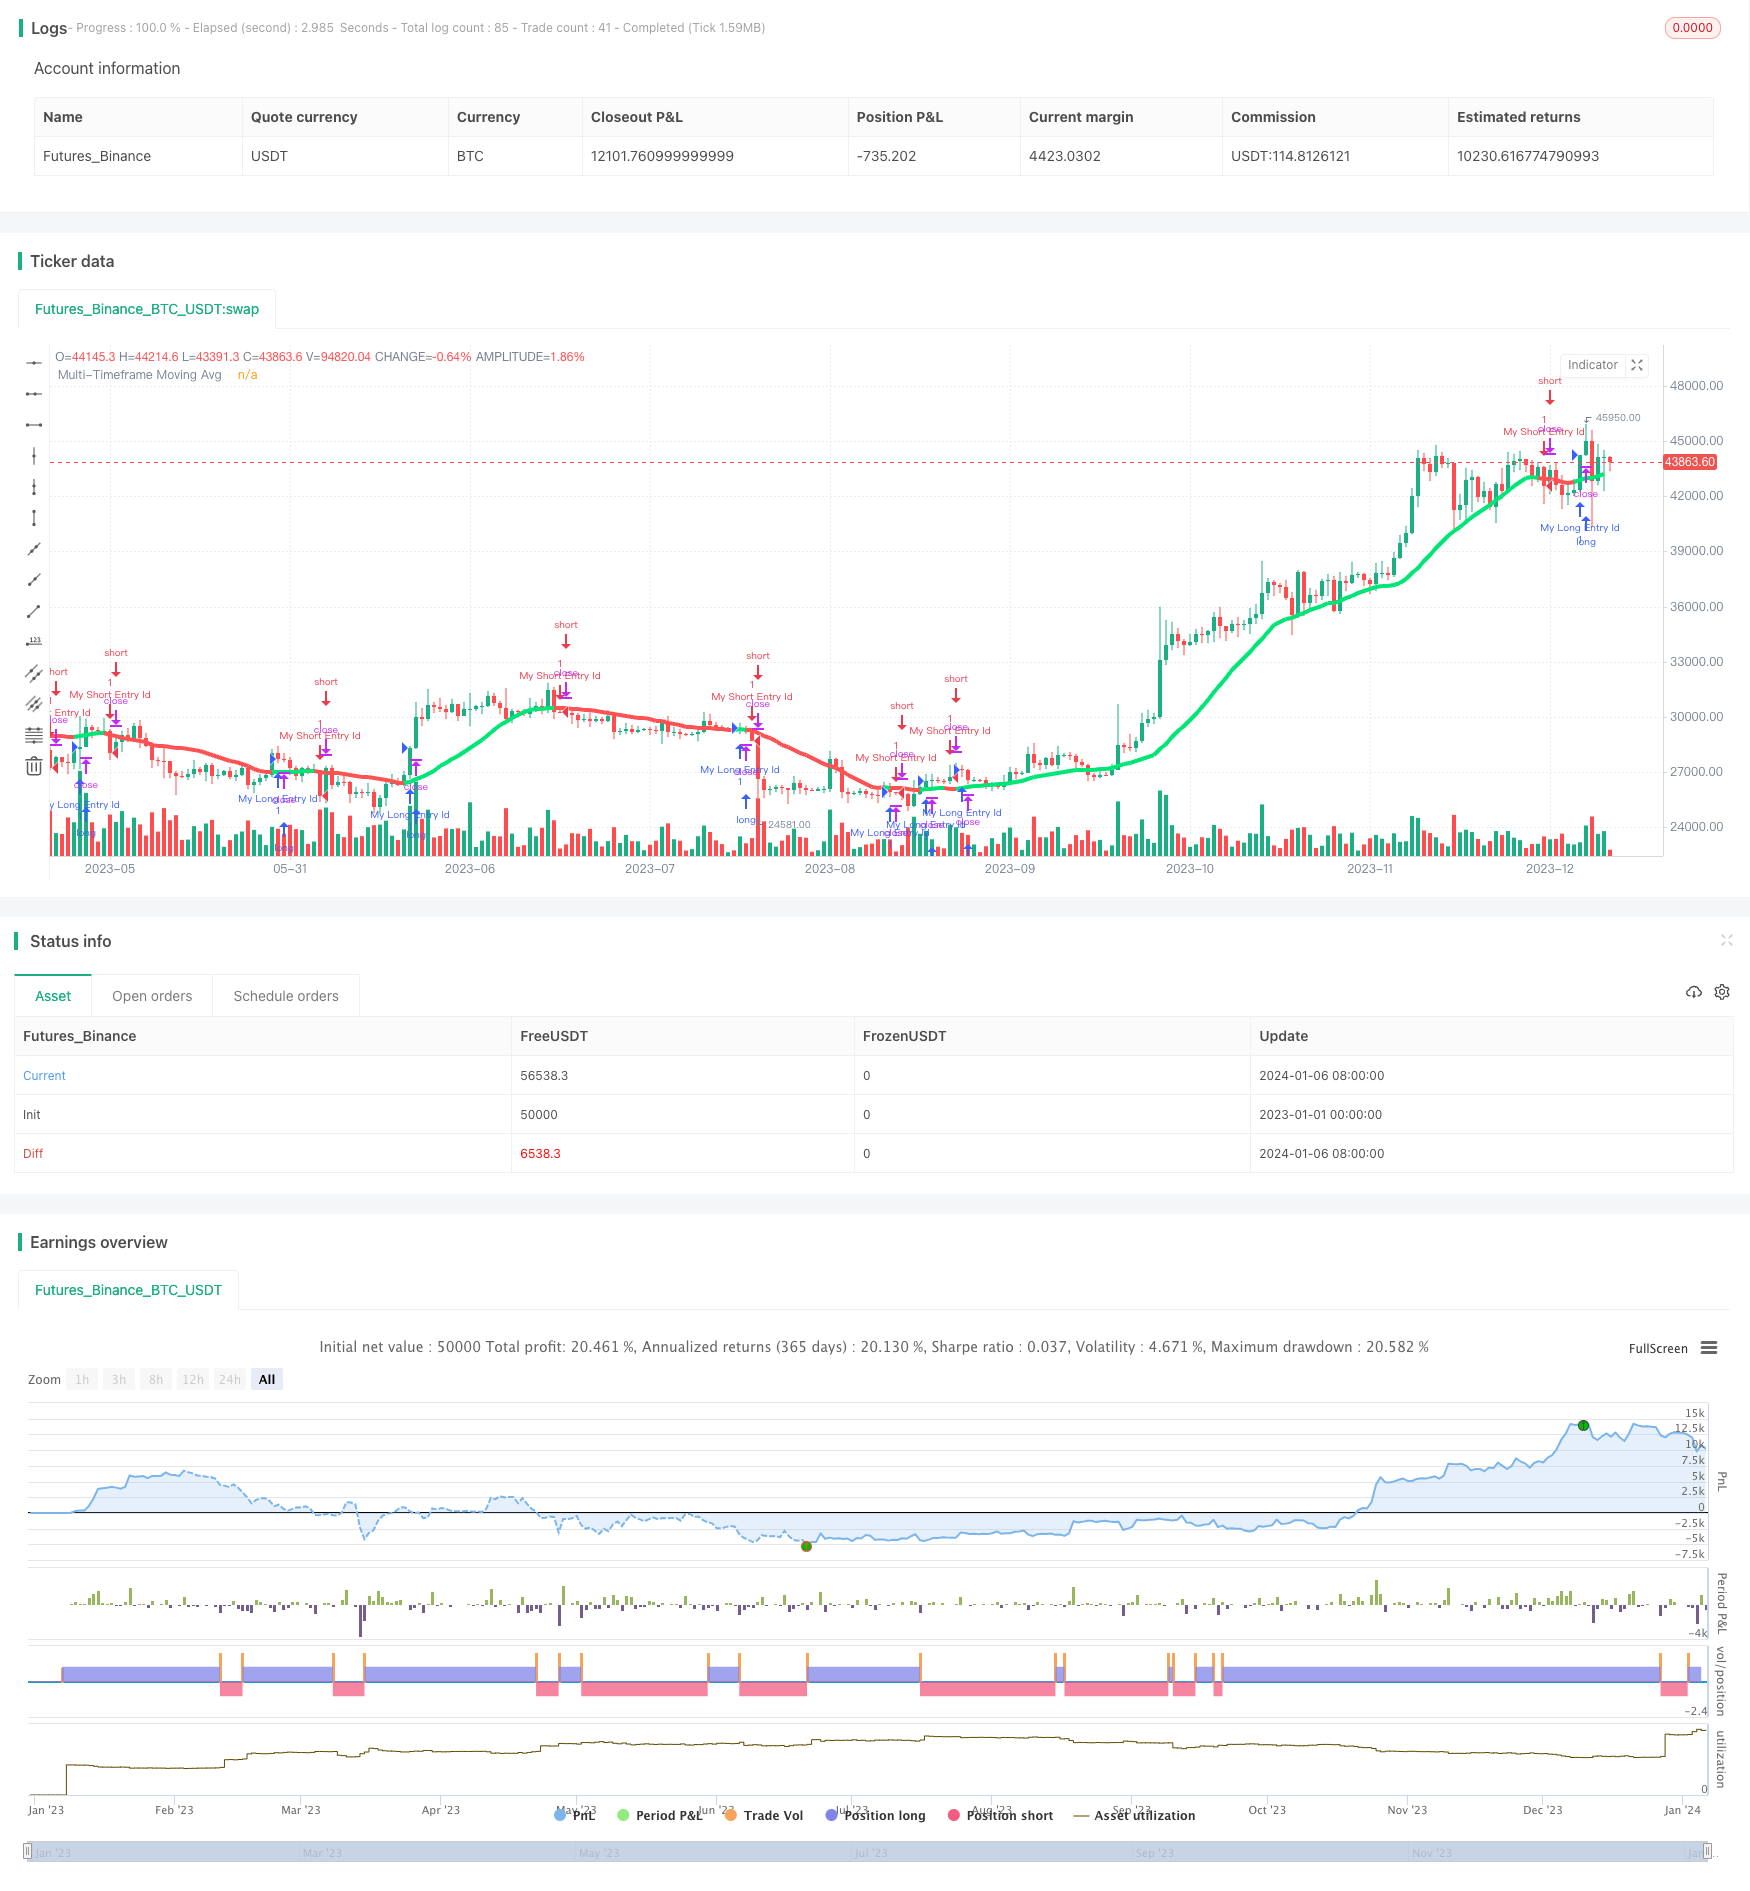
/*backtest
start: 2023-01-01 00:00:00
end: 2024-01-07 00:00:00
period: 1d
basePeriod: 1h
exchanges: [{"eid":"Futures_Binance","currency":"BTC_USDT"}]
*/

//@version=3
strategy("Moving averages-Strategy", overlay=true)
//Created by user ChrisMoody 4-24-2014
//Plots The Majority of Moving Averages
//Defaults to Current Chart Time Frame --- But Can Be Changed to Higher Or Lower Time Frames
//2nd MA Capability with Show Crosses Feature

//inputs
src = close
useCurrentRes = input(true, title="Use Current Chart Resolution?")
resCustom = input(title="Use Different Timeframe? Uncheck Box Above",defval="D")
len = input(20, title="Moving Average Length - LookBack Period")
atype = input(1,minval=1,maxval=7,title="1=SMA, 2=EMA, 3=WMA, 4=HullMA, 5=VWMA, 6=RMA, 7=TEMA")
cc = input(true,title="Change Color Based On Direction?")
smoothe = input(2, minval=1, maxval=10, title="Color Smoothing - 1 = No Smoothing")
doma2 = input(false, title="Optional 2nd Moving Average")
len2 = input(50, title="Moving Average Length - Optional 2nd MA")
atype2 = input(1,minval=1,maxval=7,title="1=SMA, 2=EMA, 3=WMA, 4=HullMA, 5=VWMA, 6=RMA, 7=TEMA")
cc2 = input(true,title="Change Color Based On Direction 2nd MA?")
warn = input(false, title="***You Can Turn On The Show Dots Parameter Below Without Plotting 2nd MA to See Crosses***")
warn2 = input(false, title="***If Using Cross Feature W/O Plotting 2ndMA - Make Sure 2ndMA Parameters are Set Correctly***")
sd = input(false, title="Show Dots on Cross of Both MA's")


res = useCurrentRes ? timeframe.period : resCustom
//hull ma definition
hullma = wma(2*wma(src, len/2)-wma(src, len), round(sqrt(len)))
//TEMA definition
ema1 = ema(src, len)
ema2 = ema(ema1, len)
ema3 = ema(ema2, len)
tema = 3 * (ema1 - ema2) + ema3

avg = atype == 1 ? sma(src,len) : atype == 2 ? ema(src,len) : atype == 3 ? wma(src,len) : atype == 4 ? hullma : atype == 5 ? vwma(src, len) : atype == 6 ? rma(src,len) : tema
//2nd Ma - hull ma definition
hullma2 = wma(2*wma(src, len2/2)-wma(src, len2), round(sqrt(len2)))
//2nd MA TEMA definition
sema1 = ema(src, len2)
sema2 = ema(sema1, len2)
sema3 = ema(sema2, len2)
stema = 3 * (sema1 - sema2) + sema3

avg2 = atype2 == 1 ? sma(src,len2) : atype2 == 2 ? ema(src,len2) : atype2 == 3 ? wma(src,len2) : atype2 == 4 ? hullma2 : atype2 == 5 ? vwma(src, len2) : atype2 == 6 ? rma(src,len2) : tema

out = avg
out_two = avg2

out1 = request.security(syminfo.tickerid, res, out)
out2 = request.security(syminfo.tickerid, res, out_two)

ma_up = out1 >= out1[smoothe]
ma_down = out1 < out1[smoothe]

col = cc ? ma_up ? lime : ma_down ? red : aqua : aqua
col2 = cc2 ? ma_up ? lime : ma_down ? red : aqua : aqua

circleYPosition = out2

plot(out1, title="Multi-Timeframe Moving Avg", style=line, linewidth=4, color = col)
plot(doma2 and out2 ? out2 : na, title="2nd Multi-TimeFrame Moving Average", style=circles, linewidth=4, color=col2)
plot(sd and cross(out1, out2) ? circleYPosition : na,style=cross, linewidth=5, color=yellow)


longCondition = crossover(out1, out1[smoothe])
if (longCondition)
    strategy.entry("My Long Entry Id", strategy.long)

shortCondition = crossunder(out1, out1[smoothe])
if (shortCondition)
    strategy.entry("My Short Entry Id", strategy.short)