Strategi perdagangan ayunan berdasarkan rata-rata pergerakan ganda
Ringkasan
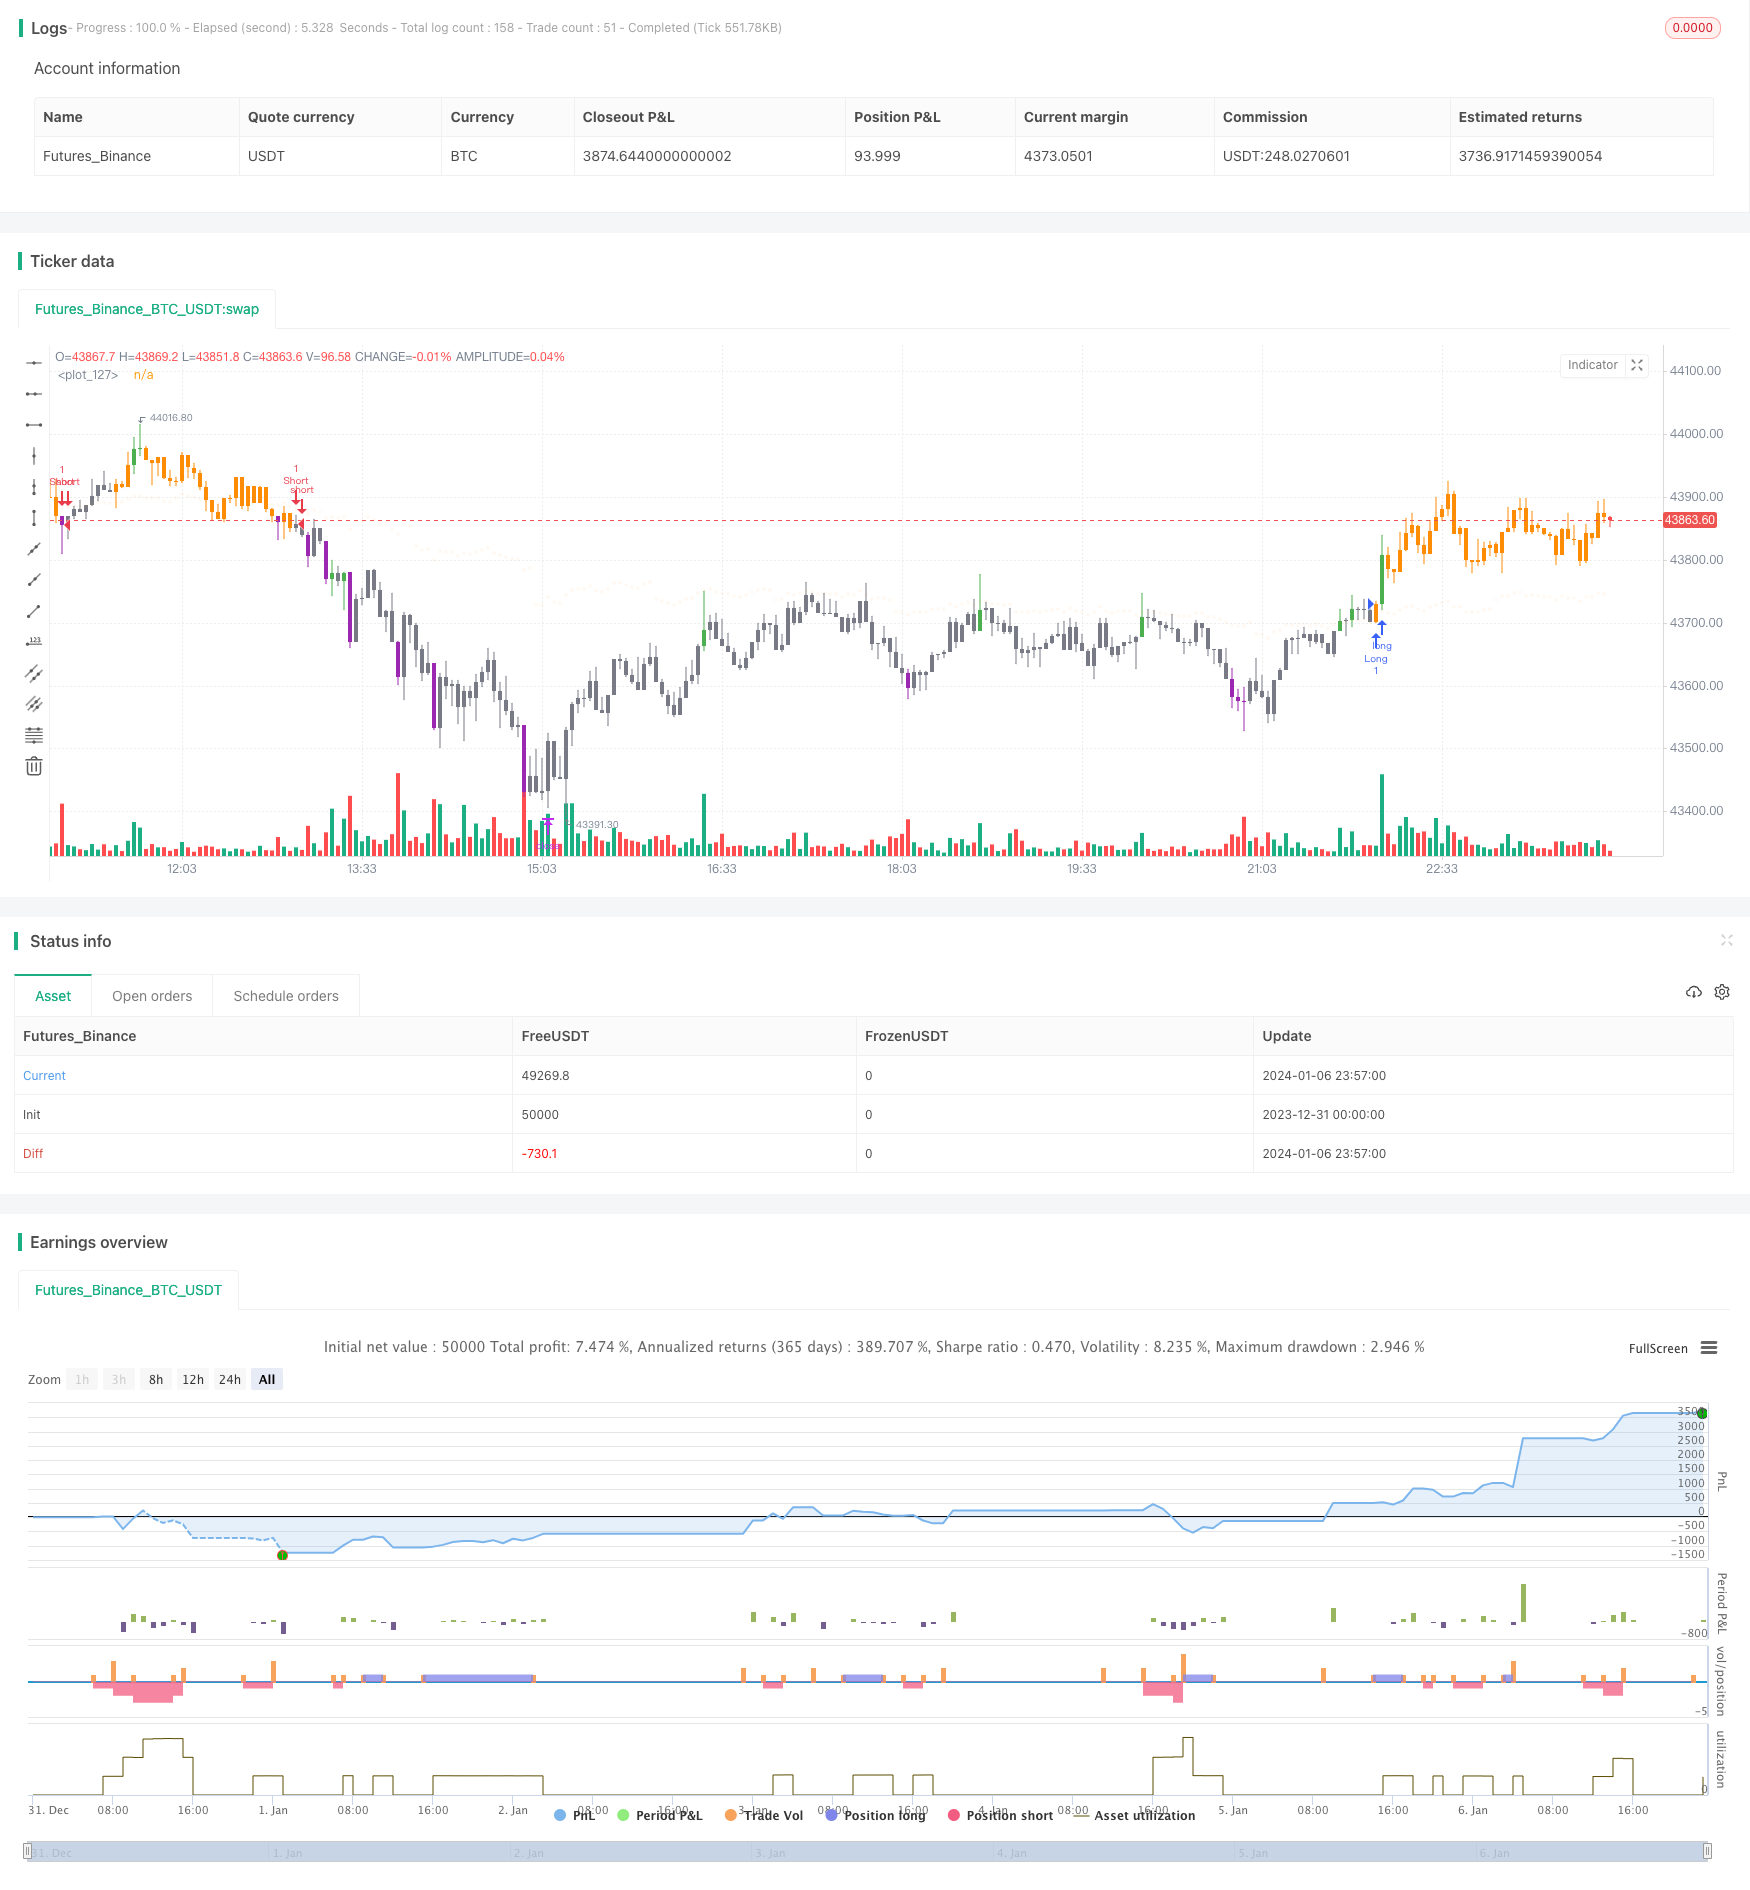
Strategi ini adalah strategi perdagangan bergoyang yang didasarkan pada dua rata-rata. Strategi ini menggunakan persilangan rata-rata bergerak cepat dan rata-rata bergerak lambat sebagai sinyal beli dan jual. Ini menghasilkan sinyal beli ketika rata-rata bergerak cepat melewati rata-rata bergerak lambat dari bawah; ini menghasilkan sinyal jual ketika rata-rata bergerak cepat melewati rata-rata bergerak lambat dari atas ke bawah.
Prinsip Strategi
Strategi ini menggunakan RMA panjang 6 sebagai rata-rata bergerak cepat dan HMA panjang 4 sebagai rata-rata bergerak lambat. Strategi ini menilai tren harga dan menghasilkan sinyal perdagangan melalui persilangan garis cepat dan lambat.
Ketika garis cepat dari bawah melewati garis lambat, berarti harga dalam waktu singkat berbalik dari turun ke bawah, dan merupakan saat konversi chip, sehingga strategi menghasilkan sinyal beli pada saat ini; ketika garis cepat dari atas melewati garis lambat, berarti harga dalam waktu singkat berbalik dari turun ke bawah, dan merupakan saat konversi chip, sehingga strategi menghasilkan sinyal jual pada saat ini.
Selain itu, strategi ini juga mendeteksi penilaian tren jangka panjang untuk menghindari perdagangan berlawanan. Hanya jika penilaian tren jangka panjang juga mendukung sinyal, sinyal beli dan jual yang sebenarnya akan dihasilkan.
Keunggulan Strategis
Strategi ini memiliki keuntungan sebagai berikut:
- Dengan menggunakan penilaian cross-over dua rata-rata, dapat secara efektif mengidentifikasi titik balik harga jangka pendek.
- Panjang jalur cepat dan lambat yang digabungkan secara wajar dapat menghasilkan sinyal perdagangan yang lebih akurat.
- Dengan menggunakan analisis tren jangka pendek dan panjang, Anda dapat menyaring sebagian besar sinyal perdagangan yang berisik.
- Implementasi Stop Loss Logic, memungkinkan penghindaran risiko secara proaktif.
- Mudah dipahami dan diterapkan, cocok untuk pemula dalam trading kuantitatif.
Risiko dan Solusi
Strategi ini juga memiliki beberapa risiko:
Strategi linier ganda mudah menghasilkan keuntungan kecil berkali-kali tetapi kerugian besar sekali. Solusinya adalah dengan menyesuaikan tingkat stop loss stop loss.
Sinyal perdagangan sering terjadi dalam situasi yang bergejolak, yang dapat menyebabkan perdagangan berlebih. Solusi adalah meredakan kondisi perdagangan dengan tepat dan mengurangi transaksi.
Parameter strategi mudah dioptimalkan dan mungkin tidak bekerja dengan baik. Solusinya adalah pengujian stabilitas parameter.
Strategi tidak bekerja dengan baik dalam situasi tren. Solusinya adalah dengan menambahkan modul penilaian tren atau menggunakan kombinasi dengan strategi tren.
Arah optimasi
Strategi ini dapat dioptimalkan lebih lanjut dengan cara:
Perbarui indikator garis rata-rata, gunakan filter adaptif seperti Kalman.
Menambahkan modul pembelajaran mesin, menggunakan pelatihan AI untuk menentukan titik jual beli.
Menambahkan modul manajemen dana untuk mengotomatisasi pengendalian risiko.
Dengan faktor frekuensi tinggi, sinyal perdagangan yang lebih kuat dapat ditemukan.
Arbitrase lintas pasar.
Meringkaskan
Strategi oscillasi linier ganda secara keseluruhan adalah strategi perdagangan kuantitatif yang khas dan praktis. Ini memiliki kemampuan beradaptasi yang kuat, dan pemula dapat belajar banyak pengetahuan tentang pengembangan strategi. Pada saat yang sama, ada banyak ruang untuk perbaikan, yang dapat dioptimalkan lebih lanjut dengan menggabungkan lebih banyak teknik kuantitatif, sehingga menghasilkan hasil strategi yang lebih baik.
/*backtest
start: 2023-12-31 00:00:00
end: 2024-01-07 00:00:00
period: 3m
basePeriod: 1m
exchanges: [{"eid":"Futures_Binance","currency":"BTC_USDT"}]
*/

// This source code is subject to the terms of the Mozilla Public License 2.0 at https://mozilla.org/MPL/2.0/
// © dc_analytics
// https://datacryptoanalytics.com/


//@version=5
strategy("Scalping Trading", overlay=true)

//  INPUTS  //
bar_color       = input(true, title='Bar Color', group='⚙ Settings',tooltip='Color chart bars.', inline = "1")
mostrar         = input(true, 'Show Alerts', group='⚙ Settings', inline = "1")
tempo           = input.timeframe('60', group='⚙ Settings', title='🕗 Timeframe', options=['1', '5', '15', '30', '60', '120', '240', '360', '720', 'D', 'W'])

i_position      = input.string("Bottom Center", title = "⚙ D-Panel Location",
 options = ["Top Right", "Bottom Center", "Bottom Right"], group='⚙ D-Panel Settings️',
 tooltip='Choose the location of the information table on the chart.(D-Panel) ')

position        = i_position == "Top Right" ? position.top_right : i_position == "Bottom Center" ? position.bottom_center : position.bottom_right

i_tam           = input.string('Big', title = '⚙ D-Painel Size',
 options = ["Tiny", "Small", "Big"], group='⚙ D-Panel Settings️',tooltip='Choose the size of the information panel (D-Panel).')

tamanho         = i_tam == "Tiny" ? size.tiny : i_tam == "Small" ? size.small : size.normal

show_tp_sl      = input(true, title='Show Take Profit/Stop Loss', group='⚙ Settings',tooltip='Show Take Profit/Stop Loss.')
TP              = input.float(defval=4500, title='Take Profit:',group='⚙ Risk Management',tooltip='Choose amount of profit')
SL              = input.float(defval=2500, title='Stop Loss:', group='⚙ Risk Management',tooltip='Choose amount of loss')
//  END INPUTS  //


//  DECLARATIONS  //
t_up    = '📈'
t_down  = '📉'

c_buy   = 'Long ⇡'
c_sell  = 'Short ⇣'

// _DECLARATION TREND
t_sma       = ta.hma(close, 200)
tend_sma    = ta.sma(close, 12)

tendencia   = request.security(syminfo.tickerid, timeframe.period, t_sma, barmerge.gaps_off, barmerge.lookahead_off)
tend_tabela = request.security(syminfo.tickerid, timeframe.period, tend_sma, barmerge.gaps_off, barmerge.lookahead_off)
// _END DECLARATION TREND

circle = plot.style_circles
//  END DECLARATIONS  //


//  COLORS  //
color gray   = color.gray
color red    = color.new(#ff8c05, 0)
color orange = color.new(#ff8c05, 0)
color silver = color.silver
color up_vol = color.new(color.green, 0)
color dn_vol = color.new(color.purple, 0)

color orange_tranp  = color.new(#ff8c05, 95)
// END COLORS //

//  SCANNER MARKET MAKERS  //
periodo  = input.int(20, 'Period Volume', group='⚙️ Scanner Market Makers Settings')
fator    = input.float(1.85, 'Proportion to the mean: (1.25 = 125% of the mean)', minval=0, group='⚙️ Scanner Market Makers Settings')
vol_up   = close > open
vol_down = open > close
vol      = volume
pesado   = volume > ta.ema(volume, periodo) * fator

palette  = pesado and vol_up ? gray : pesado and vol_down ? orange : vol_up ? silver : gray
//  END SCANNER MARKET MAKERS  //


//  LOGIC ONE  //
s = ta.rma(close, 6)
v = ta.hma(close, 4)

//  TREND
t_baixa     = tendencia > tendencia[1]
t_alta      = tendencia < tendencia[1]

te_d        = tend_tabela > tend_tabela[1]
trend       = te_d ? t_up : t_down
//  END TREND

a = request.security(syminfo.tickerid, tempo, s)
b = request.security(syminfo.tickerid, tempo, ohlc4)

c_dn   = a > b and a[1] < b[1]
c_up   = b > a and b[1] < a[1]

compra = mostrar and c_up ? a : na
venda  = mostrar and c_dn ? a : na

s_sell = venda and t_alta
s_buy  = compra and t_baixa
c_vela = b > a and te_d ? gray : orange

s_up = false
s_dw = false

b_sinal = not s_up and s_buy
s_sinal = not s_dw and s_sell

if b_sinal
    s_dw := false
    s_up := true
    s_up

if s_sinal
    s_dw := true
    s_up := false
    s_up

// END LOGIC ONE //


//  DATA TABLE  //
c = b > a ? orange : gray
c_sinal = b > a ? c_buy : c_sell
//  END DATA TABLE  //


//  PLOT/BARCOLOR  //
c_barcolor = pesado and vol_up ? up_vol : pesado and vol_down ? dn_vol : vol_up ? c : c

barcolor(bar_color ? c_barcolor : na)
plot(a, color=orange_tranp, style=circle)
//  END PLOT/BARCOLOR  //


//  TABLE  //
var dash = table.new(position=position, columns=2, rows=3, border_width=1)
if barstate.islast
    table.cell(table_id=dash, column=1, row=2, text='Scalping DCA', bgcolor=orange)
    table.cell(table_id=dash, column=1, row=0, text='Trade: ' + c_sinal)
    table.cell(table_id=dash, column=1, row=1, text='Trend: ' + trend)
//  END TABLE  //


//  SETTINGS STRATEGY  //
exitPrice = strategy.closedtrades.exit_price(strategy.closedtrades - 1)

// OPEN ORDER
if (b_sinal)
    strategy.order("Long", strategy.long , comment = "Entry: " + str.tostring(close, "#.####"))
//    strategy.exit("EXIT", trail_points = 1000, trail_offset = 0, comment_trailing = "Close with Profit: " + str.tostring(close, "#.####"))
//    strategy.entry("long", strategy.long)

if (s_sinal)
    strategy.order("Short", strategy.short , comment = "Entry: " + str.tostring(close, "#.####"))
//    strategy.exit("EXIT", trail_points = 1000, trail_offset = 0, comment_trailing = "Close with Profit: " + str.tostring(close, "#.####"))
//    strategy.entry("short", strategy.short)

//  TP/SL ORDERS
if strategy.position_size > 0
    strategy.exit('Long_Close', 'Long',profit = TP , loss=SL, qty_percent=100, comment_profit = "Profit Long: " + str.tostring(exitPrice, "#.####"), comment_loss = "Stop Long: " + str.tostring(exitPrice, "#.####"))
//if  strategy.position_size > 0
//    strategy.exit("Long", "Long", stop = longSL, limit = longTP, comment_profit = "Profit Long: " + str.tostring(exitPrice, "#.####"), comment_loss = "Stop Long: " + str.tostring(exitPrice, "#.####"))

if strategy.position_size < 0
    strategy.exit('Short_Close', 'Short',profit = TP, loss=SL, qty_percent=100, comment_profit = "Profit Short: " + str.tostring(exitPrice, "#.####"), comment_loss = "Stop Short: " + str.tostring(exitPrice, "#.####"))
//if strategy.position_size < 0
//    strategy.exit("Short", "Short", stop = shortSL, limit = shortTP, comment_profit = "Profit Short: "+ str.tostring(exitPrice, "#.####"), comment_loss = "Stop Short: " + str.tostring(exitPrice, "#.####"))

//  END SETTINGS STRATEGY  //

// LOGS
// if strategy.opentrades > 10
//     log.warning("{0} positions opened in the same direction in a row. Try adjusting `bracketTickSizeInput`", strategy.opentrades)

// last10Perc = strategy.initial_capital / 10 > strategy.equity
// if (last10Perc and not last10Perc[1])
//     log.error("The strategy has lost 90% of the initial capital!")