Kombinasi strategi terobosan harga rata-rata pergerakan ganda dan keseimbangan daya beli-pendek
Ringkasan
Strategi ini pertama-tama menggunakan Indeks Moving Average Periode 2 dan 20 untuk membangun Indeks Garis Persamaan Garis Persamaan Garis Persamaan Garis Persamaan Garis Persamaan Garis Persamaan Garis Persamaan Garis Persamaan Garis Persamaan Garis Persamaan Garis Persamaan Garis Persamaan Garis Persamaan Garis Persamaan Garis Persamaan Garis Persamaan Garis Persamaan Garis Persamaan Garis Persamaan Garis Persamaan Garis Persamaan Garis Persamaan Garis Persamaan Garis Persamaan Garis Persamaan Garis Persamaan Garis Persamaan Garis Persamaan Garis Persamaan Garis Persamaan Garis Persamaan Garis Persamaan Garis Persamaan Garis Persamaan Garis Persamaan Garis Persamaan Garis Persamaan Garis Persamaan Garis Persamaan Garis Persamaan Garis Persamaan Garis Persamaan Garis Persamaan Garis Persamaan Garis Persamaan Garis Persamaan Garis Persamaan Garis Persamaan Garis Persamaan Garis Persamaan Garis Persamaan Garis Persamaan Garis Persamaan Garis Persamaan Garis Persis Garis Persis Garis Persis Garis Persis Garis
Prinsip Strategi
2⁄20 rata-rata indikator
- Menghitung Indeks Moving Average Periode 2 dan Periode 20 (EMA)
- Ketika harga close out menembus dari satu sisi garis rata-rata ke sisi lain, sinyal perdagangan dikirim
- Penembusan 20 adalah sinyal untuk menentukan tren
- Breakout 2 adalah sinyal untuk menentukan titik masuk spesifik.
Indikator keseimbangan kekuatan udara
- Perhitungan nilai kekuatan multihead dan nilai kekuatan kosong
- Perbandingan ukuran keduanya menunjukkan kekuatan udara yang relatif lemah.
- Keunggulan sebagai penilaian tambahan untuk masuk
Pengadilan gabungan dua indikator
- Indikator Garis Dua Untuk Menentukan Arah Tren Besar
- Indikator keseimbangan kekuatan multi-udara untuk penilaian regional lokal
- Ketika kedua orang itu sepakat, sinyal perdagangan akan muncul.
Analisis Keunggulan
Keuntungan terbesar dari strategi kombinasi ini adalah kombinasi berbagai jenis indikator untuk membuat keputusan perdagangan yang lebih andal. Secara khusus, ada beberapa keuntungan:
- Menggunakan Dua Garis Persamaan untuk Memperkirakan Kecepatan, Hindari Penipuan dengan Floating Spatial
- Pertimbangan regional lokal dengan menggunakan indikator keseimbangan kekuatan multi-udara untuk mendapatkan titik masuk yang tepat
- Kedua indikator saling memverifikasi satu sama lain, yang dapat memfilter kesalahan tertentu dan mengurangi risiko perdagangan.
- Pengaturan parameter yang fleksibel, dapat dioptimalkan untuk varietas pasar yang berbeda
- Strategi yang sederhana, jelas, mudah dipahami, dan mudah dioptimalkan
Analisis risiko
Strategi ini juga memiliki beberapa risiko yang perlu diperhatikan:
- Penundaan sinyal indikator dapat menyebabkan stop loss terlalu dalam
- Indikator dua rata-rata lebih sensitif terhadap pengaturan parameter
- Indikator keseimbangan multi-udara sedikit kurang akurat dalam menilai tren jangka pendek
- Dalam situasi khusus (misal sinyal palsu yang sering terjadi), dua indikator dapat mengalami bias penilaian
Tanggapan:
- Mempersingkat periode pemegang posisi, atau mengatur stop loss bergerak yang sesuai
- Uji kombinasi parameter yang berbeda untuk menemukan yang optimal
- Indikator lain untuk konfirmasi referensi tambahan
- Parameter optimasi berdasarkan karakteristik varietas
Arah optimasi
Strategi ini dapat dioptimalkan dari beberapa aspek berikut:
- Uji lebih banyak kombinasi parameter rata-rata
- Meningkatkan strategi stop loss dan mengendalikan stop loss tunggal
- Kombinasi dengan indikator volatilitas, meningkatkan kemampuan beradaptasi parameter
- Menambahkan model pembelajaran mesin untuk optimasi parameter dinamis
- Mencoba indikator lain untuk menggantikan indikator keseimbangan multi ruang
- Mengembangkan antarmuka visual yang memudahkan pengguna untuk menguji parameter yang berbeda
Meringkaskan
Strategi ini menilai tren besar dengan indikator dua garis rata, dan membantu menentukan waktu masuk dengan indikator keseimbangan kekuatan multi-ruang. Kedua indikator saling diverifikasi, dapat secara efektif mengurangi probabilitas kesalahan. Pilihan parameter strategi fleksibel, dapat disesuaikan secara optimal untuk berbagai varietas. Secara keseluruhan, strategi ini relatif sederhana dan praktis, layak untuk dipelajari dan digunakan oleh banyak investor.
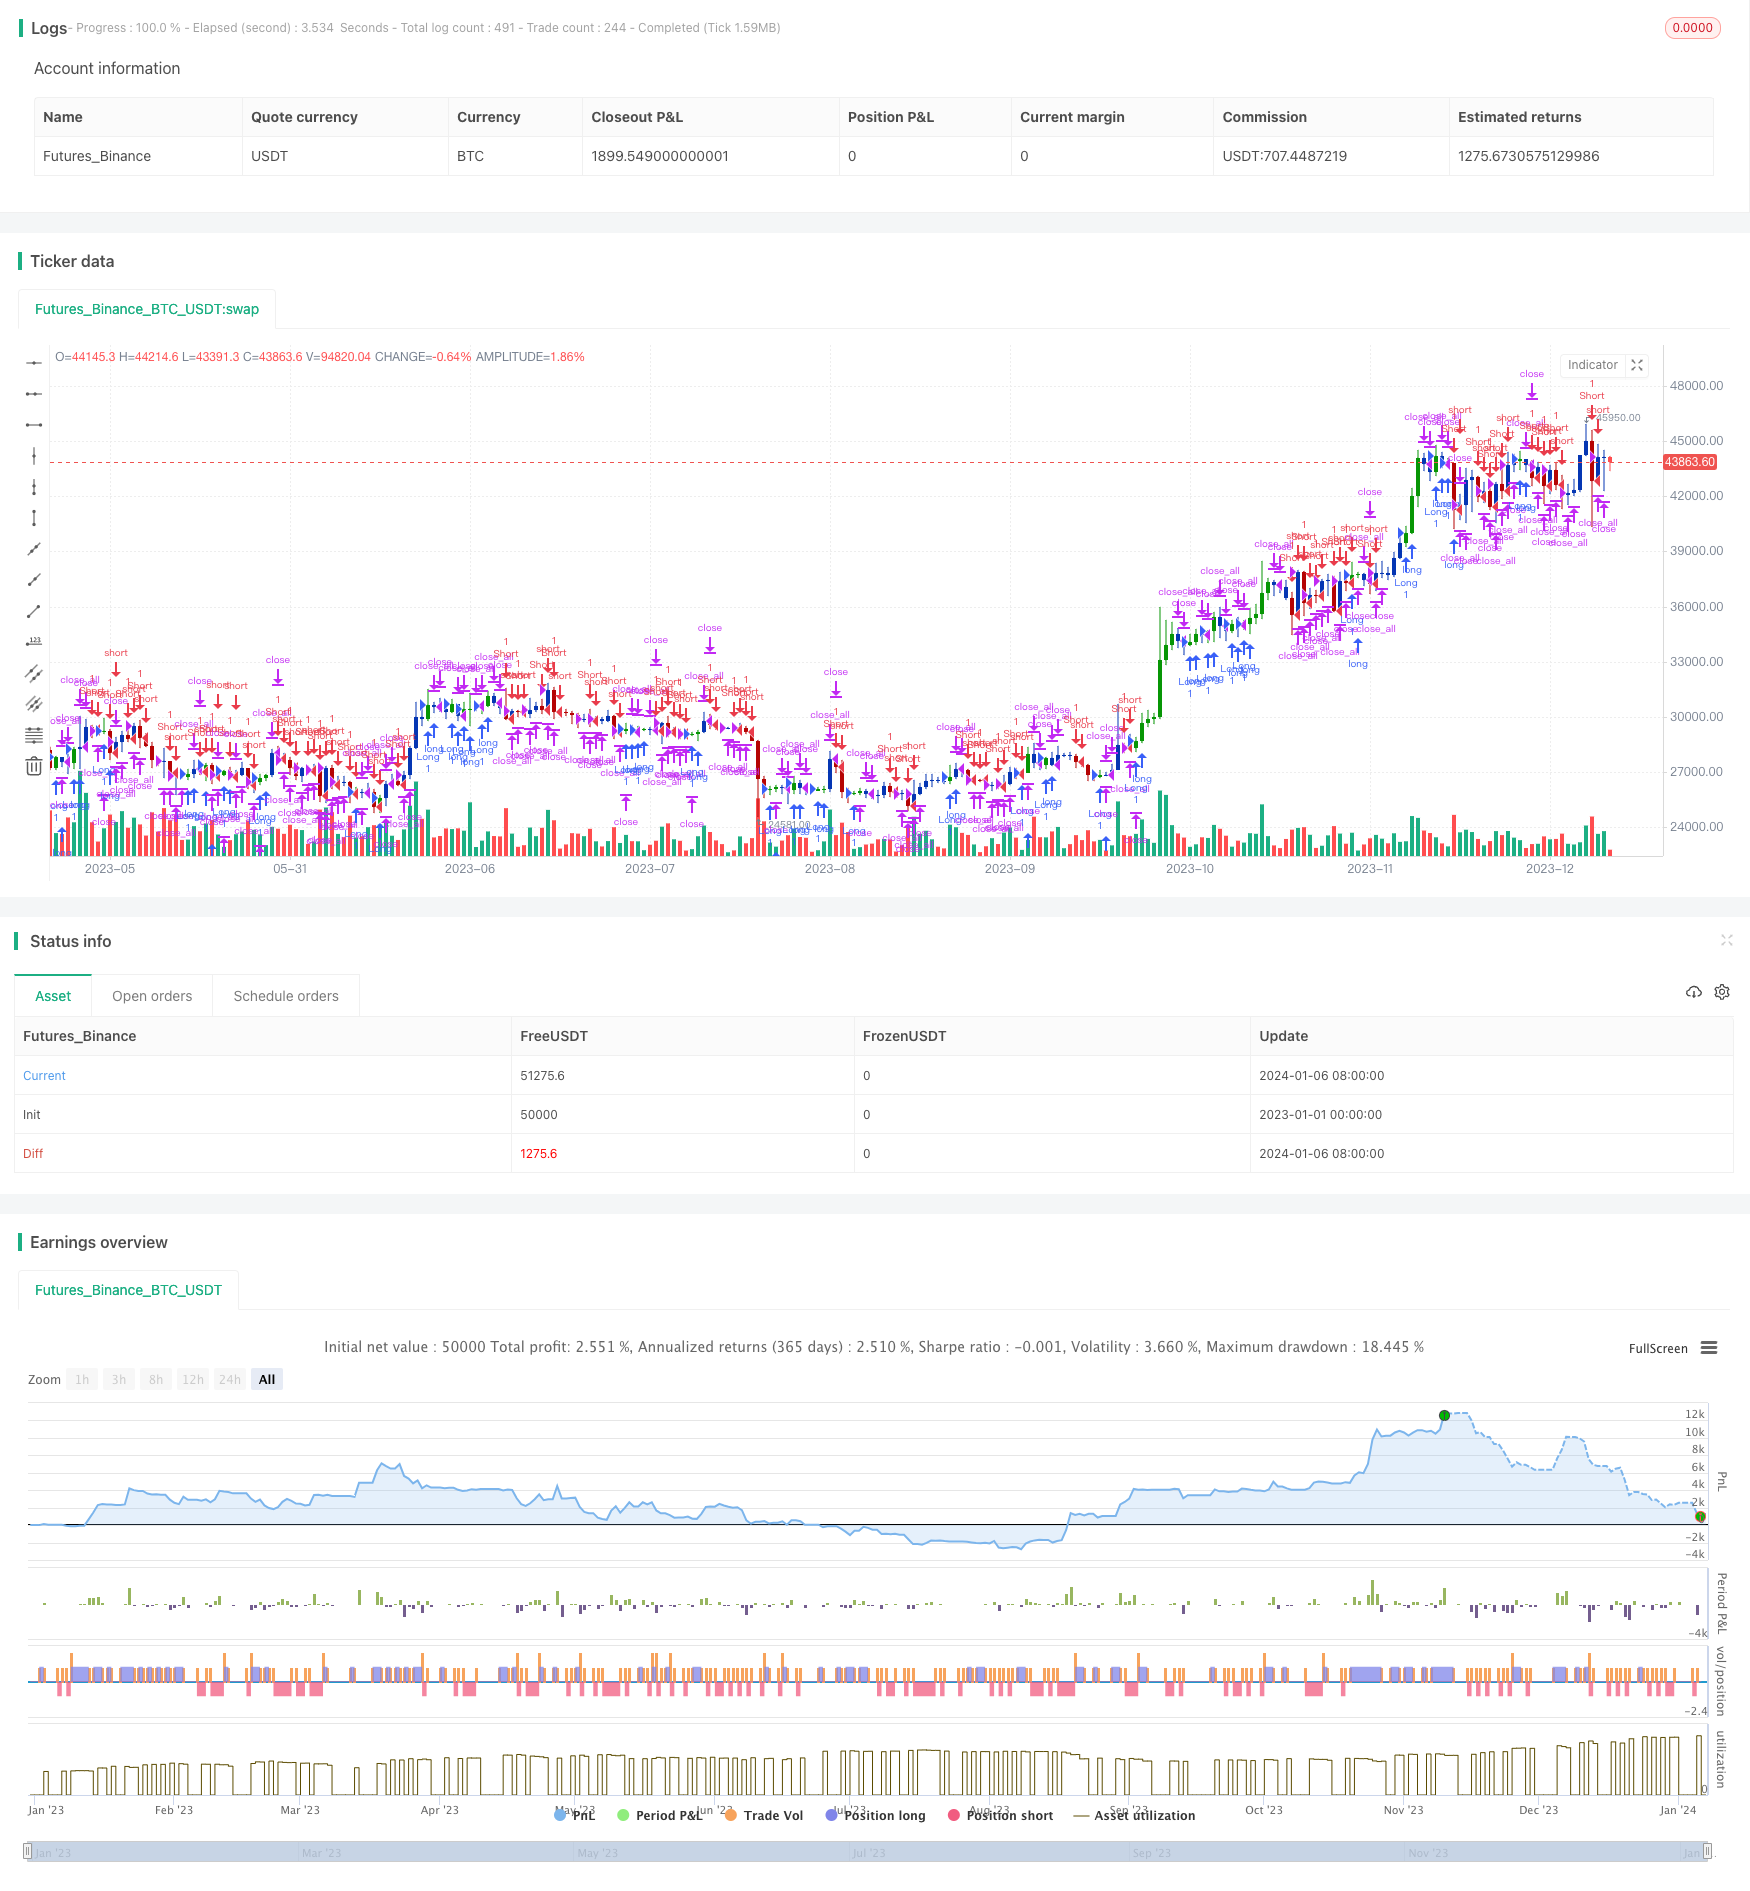
/*backtest
start: 2023-01-01 00:00:00
end: 2024-01-07 00:00:00
period: 1d
basePeriod: 1h
exchanges: [{"eid":"Futures_Binance","currency":"BTC_USDT"}]
*/

//@version=5
////////////////////////////////////////////////////////////
//  Copyright by HPotter v1.0 23/05/2022
// This is combo strategies for get a cumulative signal.
//
// First strategy
// This indicator plots 2/20 exponential moving average. For the Mov
// Avg X 2/20 Indicator, the EMA bar will be painted when the Alert criteria is met.
//
// Second strategy
//    This new indicator analyzes the balance between bullish and
//    bearish sentiment.
//    One can cay that it is an improved analogue of Elder Ray indicator.
//    To get more information please see "Bull And Bear Balance Indicator"
//    by Vadim Gimelfarb.
//
// WARNING:
// - For purpose educate only
// - This script to change bars colors.
////////////////////////////////////////////////////////////
EMA20(Length) =>
    pos = 0.0
    xPrice = close
    xXA = ta.ema(xPrice, Length)
    nHH = math.max(high, high[1])
    nLL = math.min(low, low[1])
    nXS = nLL > xXA or nHH < xXA ? nLL : nHH
    iff_1 = nXS < close[1] ? 1 : nz(pos[1], 0)
    pos := nXS > close[1] ? -1 : iff_1
    pos


BBB(SellLevel,BuyLevel) =>
    pos = 0.0
    value = close < open ?
              close[1] > open ?  math.max(close - open, high - low) : high - low :
                 close > open ?
                  close[1] > open ? math.max(close[1] - low, high - close) : math.max(open - low, high - close) :
                   high - close > close - low ?
                     close[1] > open ? math.max(close[1] - open, high - low) :high - low :
                      high - close < close - low ?
                         close > open ? math.max(close - low, high - close) : open - low :
                           close > open ? math.max(close[1] - open , high - close) :
                             close[1] < open ? math.max(open - low, high - close) : high - low

    value2 =close < open ?
              close[1] < open ?  math.max(high - close[1], close - low) : math.max(high - open, close - low) :
               close > open ?
                 close[1] > open ?  high - low : math.max(open - close[1], high - low) :
                  high - close > close - low ?
                   close[1] < open ? math.max(high - close[1], close - low) : high - open :
                     high - close < close - low ?
                      close[1] > open ?  high - low : math.max(open - close, high - low) :
                       close[1] > open ? math.max(high - open, close - low) :
                         close[1] < open? math.max(open - close, high - low): high - low
    nBBB = value2 - value
    pos :=  nBBB < SellLevel ? -1 :
    	     nBBB >= BuyLevel ? 1 : nz(pos[1], 0)
    pos

strategy(title='Combo 2/20 EMA & Bull And Bear Balance', shorttitle='Combo', overlay=true)
var I1 = '●═════ 2/20 EMA ═════●'
Length = input.int(14, minval=1, group=I1)
var I2 = '●═════  Bull And Bear Balance ═════●'
SellLevel = input.float(-15, step=0.01, group=I2)
BuyLevel = input.float(15, step=0.01, group=I2)
var misc = '●═════ MISC ═════●'
reverse = input.bool(false, title='Trade reverse', group=misc)
var timePeriodHeader = '●═════ Time Start ═════●'
d = input.int(1, title='From Day', minval=1, maxval=31, group=timePeriodHeader)
m = input.int(1, title='From Month', minval=1, maxval=12, group=timePeriodHeader)
y = input.int(2005, title='From Year', minval=0, group=timePeriodHeader)
StartTrade = time > timestamp(y, m, d, 00, 00) ? true : false
posEMA20 = EMA20(Length)
prePosBBB = BBB(SellLevel,BuyLevel)
iff_1 = posEMA20 == -1 and prePosBBB == -1 and StartTrade ? -1 : 0
pos = posEMA20 == 1 and prePosBBB == 1 and StartTrade ? 1 : iff_1
iff_2 = reverse and pos == -1 ? 1 : pos
possig = reverse and pos == 1 ? -1 : iff_2
if possig == 1
    strategy.entry('Long', strategy.long)
if possig == -1
    strategy.entry('Short', strategy.short)
if possig == 0
    strategy.close_all()
barcolor(possig == -1 ? #b50404 : possig == 1 ? #079605 : #0536b3)