Strategi trailing stop loss berdasarkan titik stop loss dan take profit
Ringkasan
Gagasan inti dari strategi ini adalah menggunakan persilangan EMA dan WMA sebagai sinyal masuk, dan digabungkan dengan stop loss yang didasarkan pada perhitungan poin untuk melakukan perdagangan. Keuntungan terbesarnya adalah bahwa risiko dapat dikontrol dengan sangat fleksibel dan tepat, dengan menyesuaikan ukuran poin untuk mengontrol besarnya stop loss.
Prinsip Strategi
Ketika EMA dari bawah ke atas menembus WMA, maka akan muncul sinyal stop loss. Setelah memasuki posisi, maka akan ada perhitungan titik entry secara real time, dan berdasarkan hal tersebut akan ada pengaturan stop loss dan stop loss. Misalnya, jika Anda mengatur stop loss 20 dan stop loss 100, maka harga stop loss akan dikurangi 20 poin*Nilai kontrak, harga stop loss adalah harga masuk ditambah 100 poin*Nilai kontrak. Untuk mengendalikan risiko dan keuntungan.
Selain itu, strategi ini juga dapat digunakan untuk membandingkan stop loss saat ini dengan stop loss di masa lalu, untuk menyesuaikan posisi stop loss yang bergerak, dan untuk mendapatkan harga stop loss yang bergerak.
Analisis Keunggulan
Keuntungan terbesar dari strategi ini dibandingkan dengan stop loss tetap atau persentase yang biasa adalah bahwa risiko dapat dikontrol dengan sangat fleksibel dan tepat. Ukuran titik yang disesuaikan dapat secara langsung mempengaruhi ukuran stop loss. Ini sangat cocok untuk berbagai varietas dan dapat disesuaikan dengan frekuensi dan amplitudo fluktuasi pasar.
Selain itu, stop loss juga merupakan fitur yang sangat praktis. Hal ini dapat melacak dan menyesuaikan posisi stop loss sesuai dengan perubahan real-time dalam situasi, dengan memastikan pengendalian risiko, dapat mengejar keuntungan yang paling besar mungkin.
Analisis risiko
Risiko dari strategi ini terutama berasal dari dua indikator EMA dan WMA itu sendiri. Mereka sering mengirimkan sinyal yang salah dan mudah dihentikan ketika ada perubahan besar dalam pasar. Dalam hal ini, disarankan untuk meredakan poin stop loss yang sesuai, atau mempertimbangkan untuk mengganti kombinasi indikator lainnya.
Titik risiko lainnya adalah bahwa stop loss yang sulit untuk diimbangi. Jika mengejar stop loss yang lebih tinggi, biasanya diperlukan untuk mengambil risiko yang lebih besar, yang mudah untuk berhenti ketika pasar berbalik. Oleh karena itu, pengaturan stop loss harus diuji dan dievaluasi dengan hati-hati.
Arah optimasi
Strategi ini dapat dioptimalkan dari beberapa arah:
- Uji kombinasi EMA dan WMA dengan parameter yang berbeda untuk menemukan parameter yang optimal;
- Cobalah untuk mengganti atau menggabungkan indikator lain seperti MACD, KDJ, dan lain-lain untuk melihat apakah itu dapat meningkatkan tingkat kemenangan.
- Evaluasi risiko-keuntungan dari berbagai stop loss dan stop loss, untuk menemukan konfigurasi optimal;
- Studi karakteristik dari berbagai varietas, menyesuaikan parameter untuk pasar yang berbeda;
- Bergabung dengan algoritma pembelajaran mesin untuk mengoptimalkan parameter secara dinamis.
Meringkaskan
Strategi ini didasarkan pada indikator EMA dan WMA untuk pengendalian risiko. Keuntungan dari strategi ini adalah bahwa pengendalian risiko sangat fleksibel dan dapat disesuaikan dengan pasar yang berbeda.
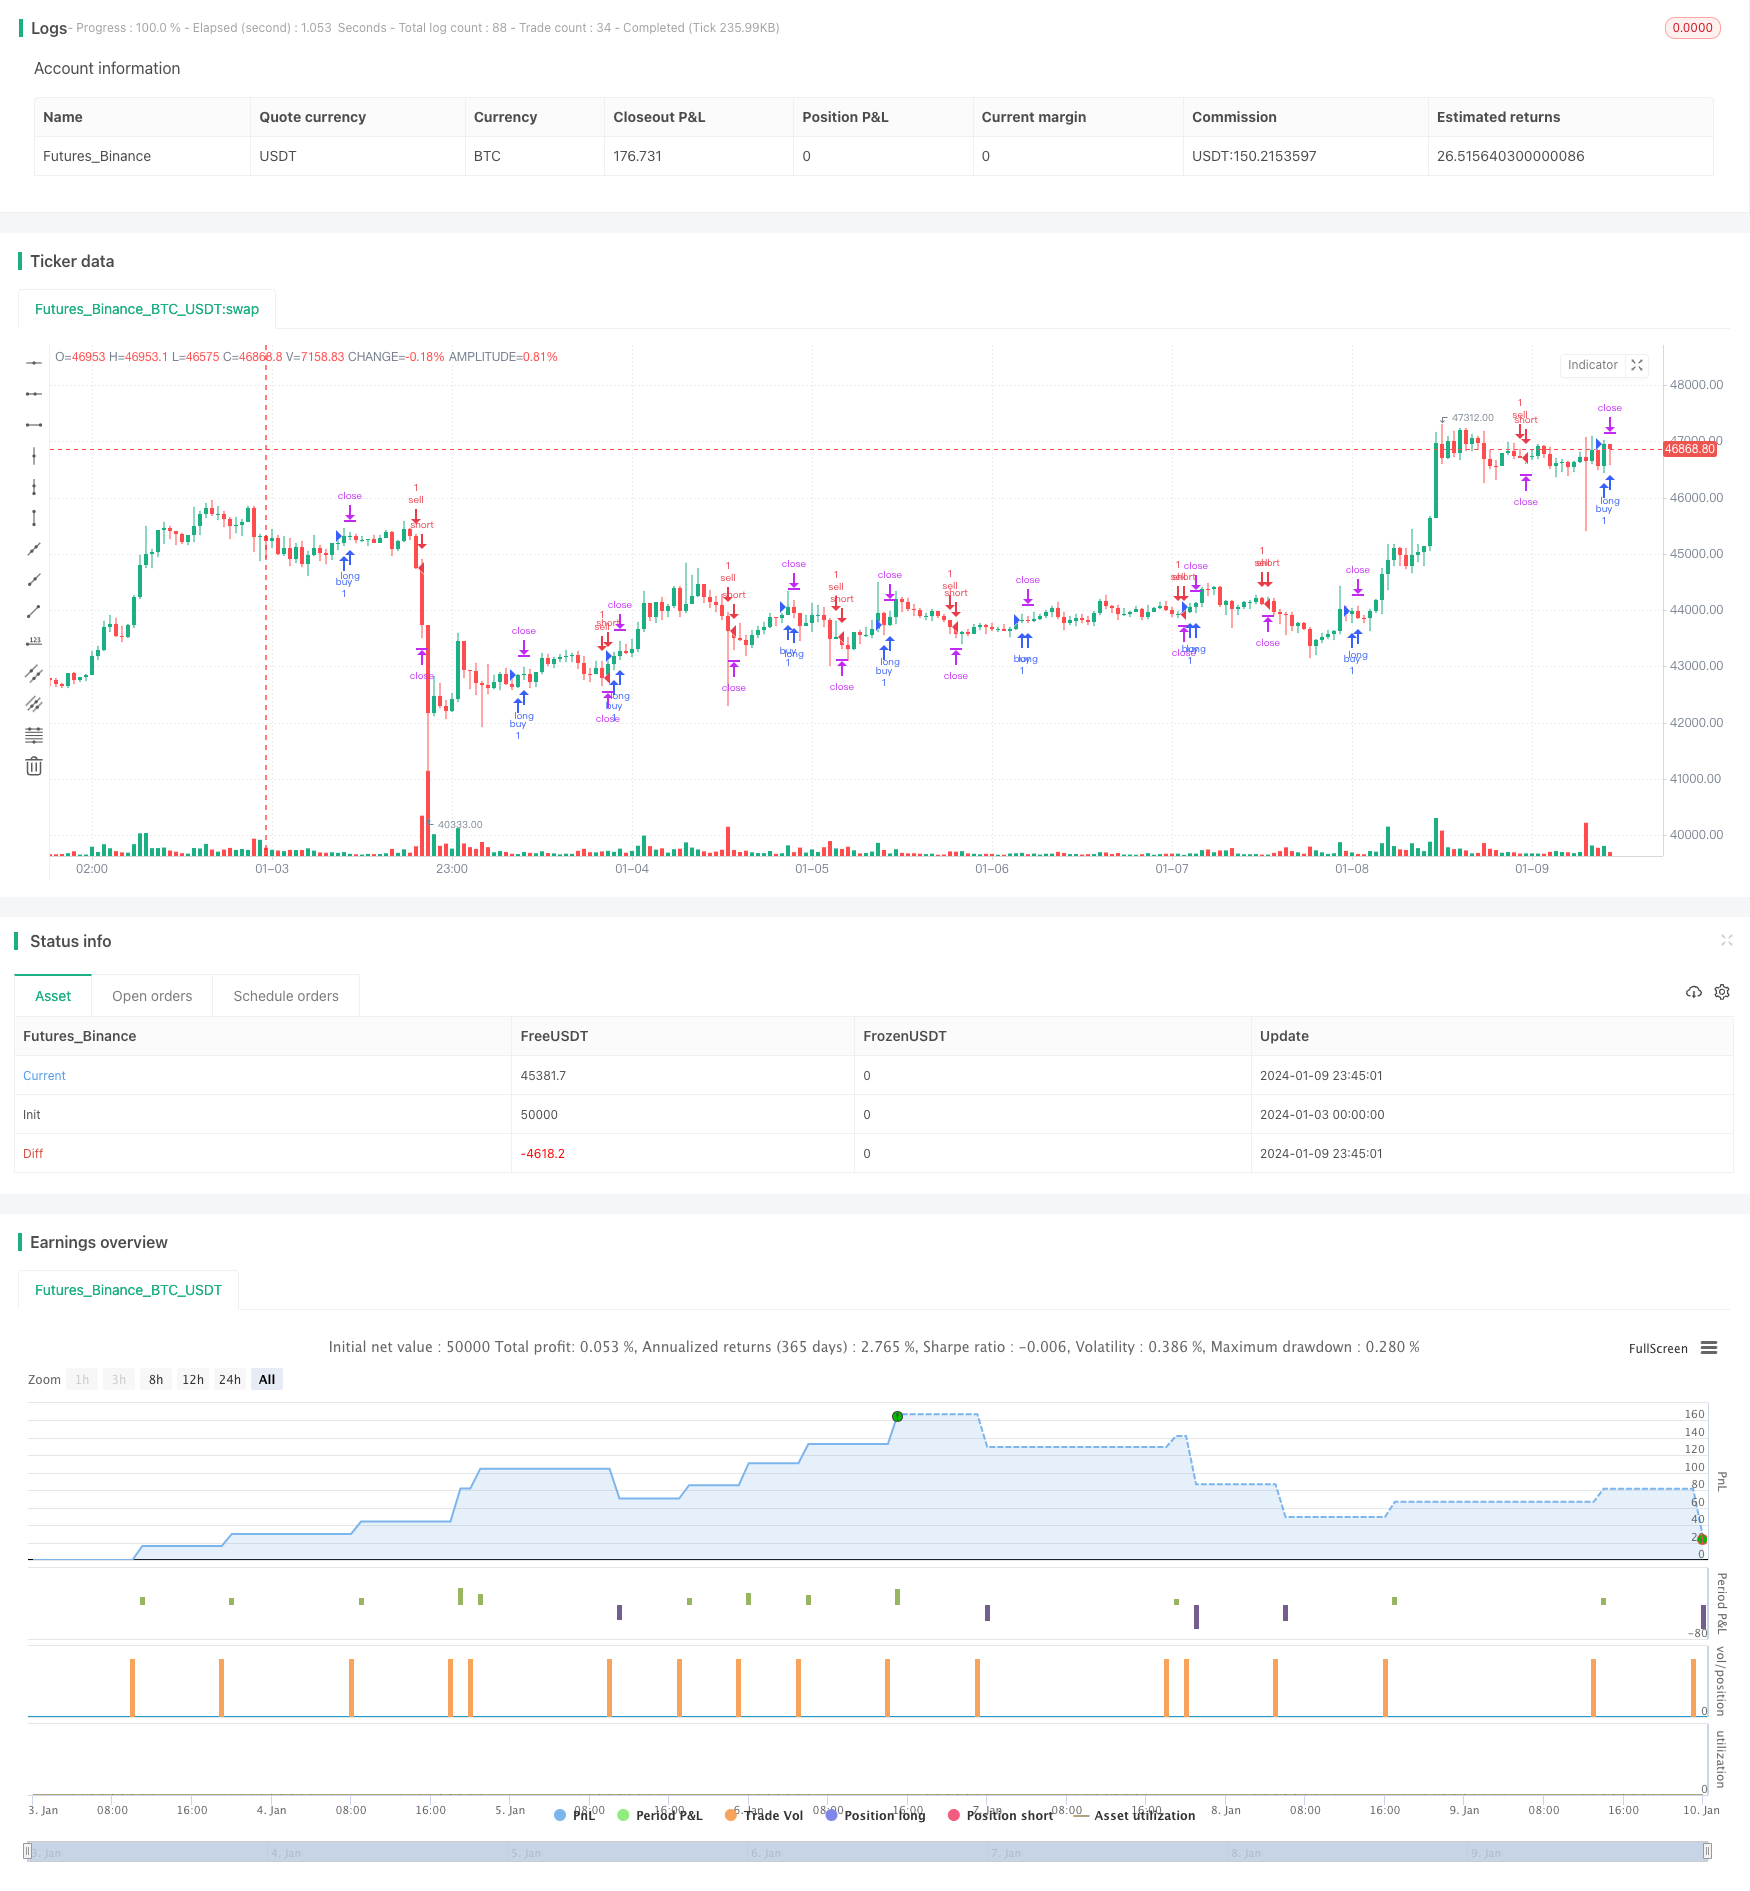
/*backtest
start: 2024-01-03 00:00:00
end: 2024-01-10 00:00:00
period: 45m
basePeriod: 5m
exchanges: [{"eid":"Futures_Binance","currency":"BTC_USDT"}]
*/

// inspiration script from: @ahmad_naquib
// inspiration script link: https://www.tradingview.com/script/tGTV8MkY-Two-Take-Profits-and-Two-Stop-Loss/
// inspiration strategy script name: Two Take Profits and Two Stop Loss


////////////
// Do not use this strategy, it's just an exmaple !! The goal from this script is to show you TP and SL based on PIPS
////////////


//@version=5
strategy('SL & TP based on Pips', "PIP SL & TP", overlay=true, initial_capital=1000)

// MA
ema_period = input(title='EMA period', defval=10)
wma_period = input(title='WMA period', defval=20)
ema = ta.ema(close, ema_period)
wma = ta.wma(close, wma_period)

// Entry Conditions
long = ta.crossover(ema, wma) and nz(strategy.position_size) == 0
short = ta.crossunder(ema, wma) and nz(strategy.position_size) == 0

// Pips Calculation
pip1 = input(20, title = "TP PIP", group = "PIP CALCULATION") * 10 * syminfo.mintick
pip2 = input(20, title = "SL PIP", group = "PIP CALCULATION") * 10 * syminfo.mintick

// Trading parameters
var bool LS = na
var bool SS = na

var float EP = na // Entry Position
var float TVL = na
var float TVS = na
var float TSL = na
var float TSS = na

var float TP1 = na
//var float TP2 = na
var float SL1 = na
///var float SL2 = na

// SL & TP Values
// there's also SL2 and TP2 in case you want to add them to your script,
//also you can add a break event in the strategy.entry section.

if short or long and strategy.position_size == 0
    EP := close
    SL1 := EP - pip2 * (short ? -1 : 1)
    //SL2 := EP - pip2 * (short ? -1 : 1)

    TP1 := EP + pip1 * (short ? -1 : 1)
    //TP2 := EP + pip1 * 2 * (short ? -1 : 1)


// current trade direction
LS := long or strategy.position_size > 0
SS := short or strategy.position_size < 0

// adjust trade parameters and trailing stop calculations
TVL := math.max(TP1, open) - pip1[1]
TVS := math.min(TP1, open) + pip1[1]
TSL := open[1] > TSL[1] ? math.max(TVL, TSL[1]) : TVL
TSS := open[1] < TSS[1] ? math.min(TVS, TSS[1]) : TVS

//if LS and high > TP1
    //if open <= TP1
        //SL2 := math.min(EP, TSL)

//if SS and low < TP1
    //if open >= TP1
        //SL2 := math.max(EP, TSS)


// Closing conditions
// and those are a closing conditions in case you want to add them.

//close_long = LS and open < SL2
//close_short = SS and open > SL2

// Buy
if (long and not SS)
    strategy.entry('buy', strategy.long)
strategy.exit('exit1', from_entry='buy', stop=SL1, limit=TP1, qty_percent=100)
//strategy.exit('exit2', from_entry='buy', stop=SL2, limit=TP2)

// Sell
if (short and not LS)
    strategy.entry('sell', strategy.short)
strategy.exit('exit3', from_entry='sell', stop=SL1, limit=TP1, qty_percent=100)
//strategy.exit('exit4', from_entry='sell', stop=SL2, limit=TP2)

// Plots
// those are plots for the lines of The tp and sl. they are really useful, and in the next update I will use a filling option.

a = plot(strategy.position_size > 0 ? SL1 : na, color=color.new(#af0829, 30), linewidth = 2, style=plot.style_linebr)
b = plot(strategy.position_size < 0 ? SL1 : na, color=color.new(#af0829, 30), linewidth = 2, style=plot.style_linebr)

c = plot(strategy.position_size > 0 ? TP1 : na, color=color.new(#2e7e00, 30), linewidth = 2, style=plot.style_linebr)
d = plot(strategy.position_size < 0 ? TP1 : na, color=color.new(#2e7e00, 30), linewidth = 2, style=plot.style_linebr)

g = plot(strategy.position_size >= 0 ? na : EP, color=color.new(#ffffff, 50), style=plot.style_linebr)
h = plot(strategy.position_size <= 0 ? na : EP, color=color.new(#ffffff, 50), style=plot.style_linebr)


// those are plot for the TP2 and SL2, they are optional if you want to add them.

//e = plot(strategy.position_size > 0 ? TP2 : na, color=color.new(#00ced1, 0), style=plot.style_linebr)
//f = plot(strategy.position_size < 0 ? TP2 : na, color=color.new(#00ced1, 0), style=plot.style_linebr)


//those are the plot for the ema and wma strategy for short and long signal. they are not really a good strategy, I just used them as an example
//but you have the option to plot them or not.
// do not use this strategy, it's just an exmaple !! The goal from this script is to show you TP and SL based on PIPS

//plot(ema, title='ema', color=color.new(#fff176, 0))
//plot(wma, title='wma', color=color.new(#00ced1, 0))