Strategi Mengikuti Tren yang Solid
Ringkasan
Gagasan utama dari strategi ini adalah kombinasi dari 123 reversal patterns dan indikator Smart Money Flow Index (SMI) untuk mencapai perdagangan trend tracking yang stabil. Strategi ini akan membangun posisi multihead atau posisi kosong yang sesuai ketika dua sinyal mengeluarkan sinyal beli atau jual pada saat yang sama.
Prinsip Strategi
Strategi ini terdiri dari dua bagian:
Strategi 123 berbalik: Strategi ini didasarkan pada harga penutupan saham dan indikator Stoch 9 untuk melakukan perdagangan berbalik. Secara khusus, ketika hubungan harga penutupan dua hari berturut-turut berbalik (yaitu, harga penutupan hari sebelumnya lebih tinggi dari dua hari sebelumnya, dan harga penutupan hari berikutnya lebih rendah dari hari sebelumnya), dan garis cepat Stoch lebih tinggi dari garis lambat, kosong; ketika hubungan harga penutupan dua hari berturut-turut berbalik (yaitu, harga penutupan hari sebelumnya lebih rendah dari dua hari sebelumnya, dan harga penutupan hari berikutnya lebih tinggi dari hari sebelumnya), dan garis cepat Stoch lebih rendah dari garis lambat, kosong.
Strategi SMI: Strategi ini didasarkan pada indeks aliran dana cerdas untuk pelacakan tren. Indeks SMI dapat mencerminkan permainan dana lembaga dan dana ritel.
Strategi ini mengambil posisi multihead ketika 123 reversal dan indeks SMI mengirim sinyal beli pada saat yang sama; strategi ini mengambil posisi kosong ketika keduanya mengirim sinyal jual pada saat yang sama.
Keunggulan Strategis
Strategi ini, yang dikombinasikan dengan pola reversal dan indikator pelacakan tren, dapat secara efektif mengidentifikasi titik-titik reversal pasar dan melacak tren, mencapai keuntungan yang stabil. Keunggulan spesifiknya adalah sebagai berikut:
123 bentuk reversal memiliki tingkat kemenangan dan keuntungan yang lebih tinggi, sehingga dapat secara efektif mengidentifikasi peluang reversal jangka pendek.
Indikator SMI dapat mencerminkan aliran dana lembaga, dan melacak dana lembaga dapat memperoleh keuntungan yang lebih stabil.
Kombinasi dengan penggunaan reversal pattern dan trend tracking indicator, dapat meningkatkan kualitas sinyal, mengurangi transaksi yang tidak perlu, dan mengendalikan risiko secara efektif.
Risiko Strategis
Strategi ini juga memiliki beberapa risiko, yang terkonsentrasi pada beberapa aspek:
123 bentuk pembalikan ada risiko sinyal palsu tertentu, tidak dapat sepenuhnya menghindari perdagangan yang merugikan. Anda dapat mengoptimalkan parameter dengan tepat, meningkatkan kualitas sinyal.
Indikator SMI memiliki keterlambatan tertentu dan tidak dapat sepenuhnya mencerminkan arus dana secara real-time. Indikator ini dapat digabungkan dengan indikator lain untuk verifikasi dan meningkatkan akurasi.
Sinyal ganda membawa masalah yang terlalu konservatif, mungkin kehilangan tren unilateral yang lebih kuat. Kondisi sinyal dapat dilonggarkan dengan tepat dan standar penyaringan dapat dikurangi.
Arah optimasi
Strategi ini juga dapat dioptimalkan lebih lanjut dalam beberapa hal:
Optimalkan parameter, cari kombinasi parameter yang optimal, dan tingkatkan profitabilitas strategi.
Menambahkan mekanisme penghentian kerugian, yang dapat secara efektif mengendalikan kerugian tunggal.
Dalam kombinasi dengan indikator atau bentuk lain, untuk lebih memverifikasi kualitas sinyal, meningkatkan akurasi sinyal.
Optimalkan parameter untuk varietas yang berbeda untuk meningkatkan adaptasi strategi.
Meringkaskan
Strategi ini memiliki visi yang jelas dan efektif, dengan kombinasi reversal dan trend tracking indicator, dapat secara stabil mengidentifikasi peluang reversal jangka pendek dan melacak tren jangka menengah dan panjang. Dengan optimasi parameter dan perbaikan dalam desain mekanisme, strategi ini dapat lebih meningkatkan profitabilitas dan kemampuan kontrol risiko.
Overview
The main idea of this strategy is to combine the 123 reversal pattern and the Smart Money Index (SMI) indicator to achieve stable trend tracking trading. The strategy will only establish corresponding long or short positions when both signals issue buy or sell signals at the same time.
Strategy Principle
The strategy consists of two parts:
123 reversal strategy: This strategy implements reversal trading based on the closing price of the stock and the 9-day Stoch indicator. Specifically, go short when the closing price relationship reverses for two consecutive days (i.e. the previous closing price is higher than the one before the previous day, and the next closing price is lower than the previous day), and Stoch fast line is above slow line; go long when the closing price relationship reverses for two consecutive days (i.e. the previous closing price is lower than the one before the previous day, and the next closing price is higher than the previous day), and Stoch fast line is below slow line.
SMI strategy: This strategy implements trend tracking based on the Smart Money Index. The SMI indicator can reflect the game between institutional funds and retail funds. The rise of SMI indicates that institutional funds are absorbing funds, while the fall indicates that institutional funds are selling out. Go long when SMI rises and go short when SMI falls.
The strategy will only take a long position when both the 123 reversal pattern and the SMI indicator issue a buy signal at the same time. It will only take a short position when both issue a sell signal at the same time.
Strategy Advantages
The strategy combines reversal patterns and trend tracking indicators to effectively identify market reversal points and track trends for steady profits. The specific advantages are as follows:
The 123 reversal pattern has a relatively high win rate and profit rate, which can effectively identify short-term reversal opportunities.
The SMI indicator can reflect the direction of institutional funds. Tracking institutional funds can obtain more steady profits.
The combined use of reversal patterns and trend tracking indicators can improve the quality of signals, reduce unnecessary trading, and effectively control risks.
Strategy Risks
The strategy also has some risks, mainly concentrated in the following areas:
The 123 reversal pattern has a certain risk of false signals and cannot completely avoid losing trades. Parameters can be optimized appropriately to improve signal quality.
The SMI indicator has a certain lag and cannot completely reflect the direction of funds in real time. Other indicators can be combined for verification to improve accuracy.
Double signals can lead to over-conservative problems, possibly missing stronger one-sided trending opportunities. Signal conditions can be appropriately relaxed to reduce filtering criteria.
Optimization Directions
The strategy can also be further optimized in the following aspects:
Optimize parameters to find the optimal parameter combination and improve the profitability of the strategy.
Add stop loss mechanisms to effectively control single loss.
Combine other indicators or patterns to further verify signal quality and improve signal accuracy.
Optimize parameters separately for different varieties to improve the adaptability of the strategy.
Summary
The overall idea of the strategy is clear, effectively combining reversal patterns and trend tracking indicators to steadily identify short-term reversal opportunities and track medium-to-long term trends. By improving parameters optimization and mechanism design, the profitability and risk control capabilities of the strategy can be further enhanced.
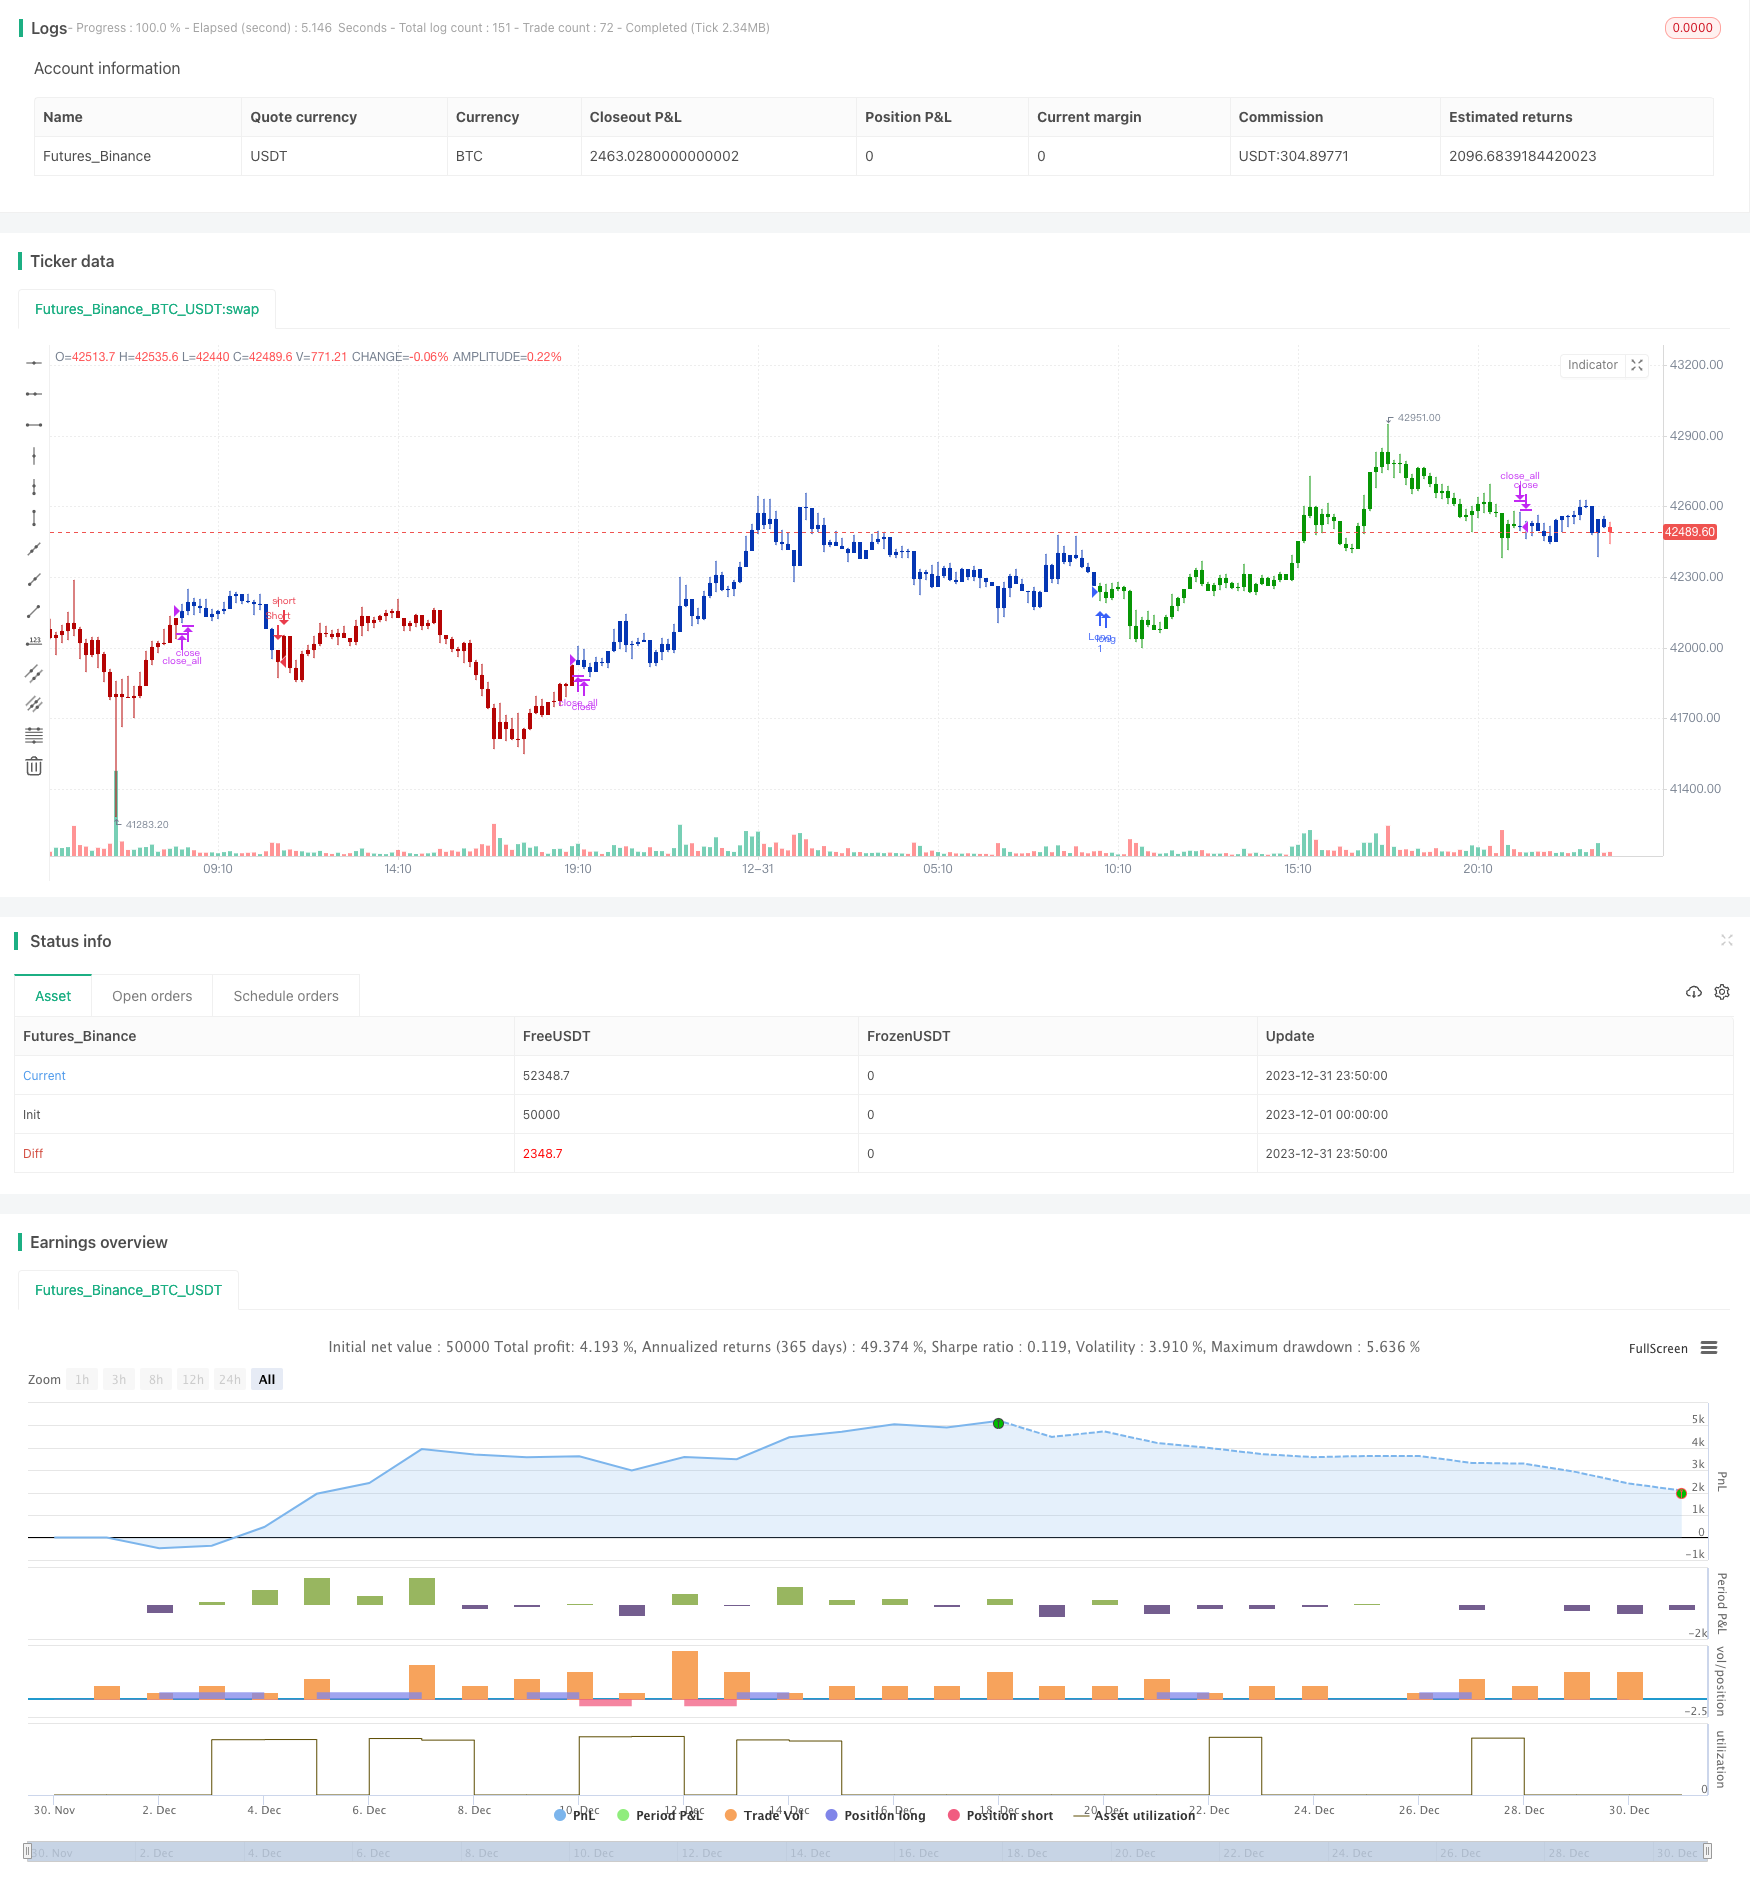
/*backtest
start: 2023-12-01 00:00:00
end: 2023-12-31 23:59:59
period: 10m
basePeriod: 1m
exchanges: [{"eid":"Futures_Binance","currency":"BTC_USDT"}]
*/

//@version=4
////////////////////////////////////////////////////////////
//  Copyright by HPotter v1.0 10/07/2021
// This is combo strategies for get a cumulative signal.
//
// First strategy
// This System was created from the Book "How I Tripled My Money In The
// Futures Market" by Ulf Jensen, Page 183. This is reverse type of strategies.
// The strategy buys at market, if close price is higher than the previous close
// during 2 days and the meaning of 9-days Stochastic Slow Oscillator is lower than 50.
// The strategy sells at market, if close price is lower than the previous close price
// during 2 days and the meaning of 9-days Stochastic Fast Oscillator is higher than 50.
//
// Second strategy
// Smart money index (SMI) or smart money flow index is a technical analysis indicator demonstrating investors sentiment.
// The index was invented and popularized by money manager Don Hays.[1] The indicator is based on intra-day price patterns.
// The main idea is that the majority of traders (emotional, news-driven) overreact at the beginning of the trading day
// because of the overnight news and economic data. There is also a lot of buying on market orders and short covering at the opening.
// Smart, experienced investors start trading closer to the end of the day having the opportunity to evaluate market performance.
// Therefore, the basic strategy is to bet against the morning price trend and bet with the evening price trend. The SMI may be calculated
// for many markets and market indices (S&P 500, DJIA, etc.)
//
// The SMI sends no clear signal whether the market is bullish or bearish. There are also no fixed absolute or relative readings signaling
// about the trend. Traders need to look at the SMI dynamics relative to that of the market. If, for example, SMI rises sharply when the
// market falls, this fact would mean that smart money is buying, and the market is to revert to an uptrend soon. The opposite situation
// is also true. A rapidly falling SMI during a bullish market means that smart money is selling and that market is to revert to a downtrend
// soon. The SMI is, therefore, a trend-based indicator.
// Some analysts use the smart money index to claim that precious metals such as gold will continually maintain value in the future.
//
// WARNING:
// - For purpose educate only
// - This script to change bars colors.
////////////////////////////////////////////////////////////
Reversal123(Length, KSmoothing, DLength, Level) =>
    vFast = sma(stoch(close, high, low, Length), KSmoothing)
    vSlow = sma(vFast, DLength)
    pos = 0.0
    pos := iff(close[2] < close[1] and close > close[1] and vFast < vSlow and vFast > Level, 1,
	         iff(close[2] > close[1] and close < close[1] and vFast > vSlow and vFast < Level, -1, nz(pos[1], 0)))
	pos


SMI(Length, tf) =>
    pos = 0.0
    nRes = 0.0
    xcloseH1 = security(syminfo.tickerid, tf, close[1])
    xopenH1 =  security(syminfo.tickerid, tf, open[1])
    nRes := nz(nRes[1], 1) - (open - close) + (xopenH1 - xcloseH1)
    xSmaRes = sma(nRes, Length)
    pos:= iff(xSmaRes > nRes, 1,
           iff(xSmaRes < nRes, -1, nz(pos[1], 0)))
    pos

strategy(title="Combo Backtest 123 Reversal & Smart Money Index (SMI)", shorttitle="Combo", overlay = true)
line1 = input(true, "---- 123 Reversal ----")
Length = input(14, minval=1)
KSmoothing = input(1, minval=1)
DLength = input(3, minval=1)
Level = input(50, minval=1)
//-------------------------
line2 = input(true, "---- Smart Money Index (SMI) ----")
LengthSMI = input(18, minval=1)
res = input(title="Resolution", type=input.resolution, defval="D")
reverse = input(false, title="Trade reverse")
posReversal123 = Reversal123(Length, KSmoothing, DLength, Level)
posSMI = SMI(LengthSMI, res)
pos = iff(posReversal123 == 1 and posSMI == 1 , 1,
	   iff(posReversal123 == -1 and posSMI == -1, -1, 0))
possig = iff(reverse and pos == 1, -1,
          iff(reverse and pos == -1 , 1, pos))
if (possig == 1 )
    strategy.entry("Long", strategy.long)
if (possig == -1 )
    strategy.entry("Short", strategy.short)
if (possig == 0)
    strategy.close_all()
barcolor(possig == -1 ? #b50404: possig == 1 ? #079605 : #0536b3 )