Strategi regresi breakout berdasarkan saluran Bollinger Bands
Ringkasan
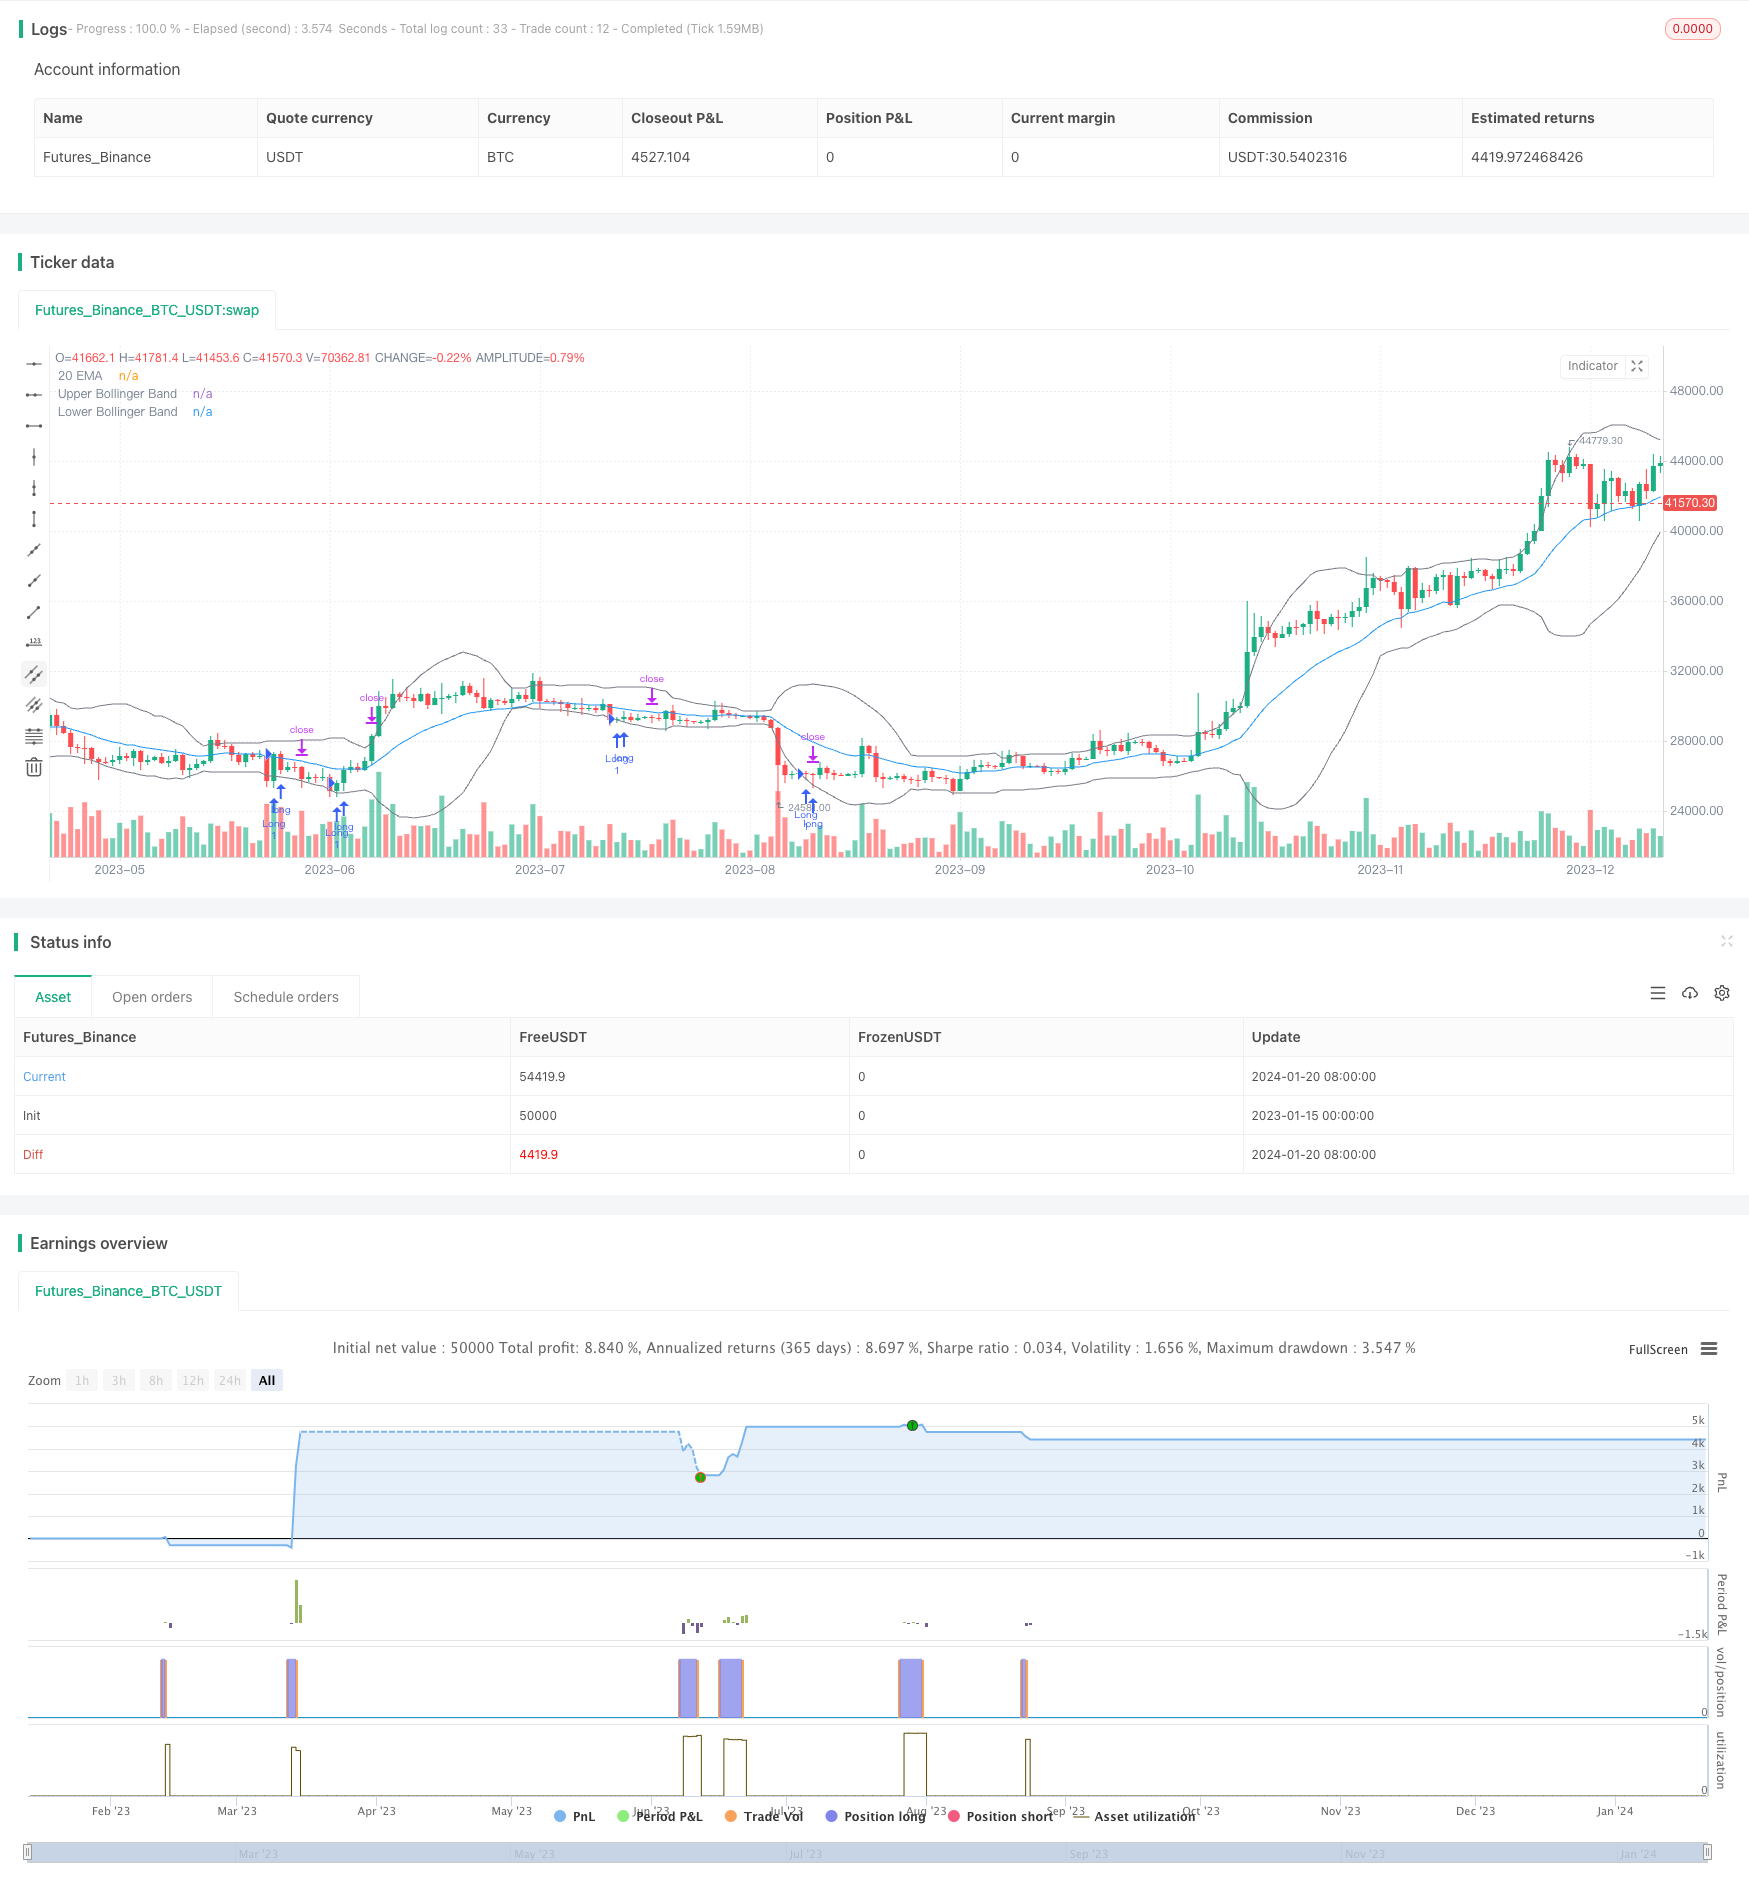
Strategi ini didasarkan pada strategi retracement breakout pada Bollinger Bands. Ketika harga turun di bawah Bollinger Bands, masuk ke posisi panjang. Harga stop loss ditetapkan sebagai harga terendah di titik masuk.
Prinsip Strategi
Strategi ini menggunakan jalur Brin dengan 20 periode. Jalur Brin terdiri dari orbit tengah, orbit atas, dan orbit bawah. Orbit tengah adalah rata-rata bergerak sederhana dengan 20 periode, orbit atas terdiri dari dua kali lipat dari perbedaan standar ditambah orbit tengah, dan orbit bawah terdiri dari dua kali lipat dari perbedaan standar dikurangi orbit tengah.
Ketika harga jatuh ke bawah, menunjukkan bahwa harga telah memasuki keadaan oversold, yang dilakukan posisi panjang masuk. Setelah masuk, harga stop loss ditetapkan sebagai harga terendah dari garis K saat masuk, tujuan stop stop adalah Brin band di atas rel.
Analisis Keunggulan Strategi
Strategi ini memiliki keuntungan sebagai berikut:
- Penggunaan BRI untuk menilai kondisi pasar overbought dan oversold memiliki efek waktu tertentu.
- Kembali ke Strategi Perdagangan, Hindari Docname
- Pengaturan Stop Loss yang Rasional untuk Mengontrol Risiko
Analisis risiko
Strategi ini juga memiliki beberapa risiko:
- Blinking tidak dapat menilai tren harga dengan sempurna, dan harga tidak akan selalu bangkit kembali setelah terjatuh
- Floating P/L mungkin memicu stop loss pertama jika harga saham terus turun
- Stop point dekat dengan rel, risiko biaya stop terlalu tinggi
Arah optimasi strategi
Strategi ini dapat dioptimalkan dalam beberapa hal:
- Optimalkan parameter Brinet untuk mencari kombinasi parameter optimal
- Menambahkan sinyal penyaringan indikator lainnya untuk meningkatkan akurasi masuk
- Optimalkan strategi Stop Loss dan Tingkatkan Rasio Keuntungan dan Kerugian
Meringkaskan
Strategi ini secara keseluruhan memiliki ide yang jelas dan memiliki beberapa operasional. Namun, efektivitasnya tidak tinggi, tidak dapat mengetahui tren harga dengan sempurna. Selain itu, mekanisme stop loss juga harus dioptimalkan.
/*backtest
start: 2023-01-15 00:00:00
end: 2024-01-21 00:00:00
period: 1d
basePeriod: 1h
exchanges: [{"eid":"Futures_Binance","currency":"BTC_USDT"}]
*/

// This source code is subject to the terms of the Mozilla Public License 2.0 at https://mozilla.org/MPL/2.0/
// © Ronsword
//@version=5

strategy("bb 2ND target", overlay=true)

// STEP 1. Create inputs that configure the backtest's date range
useDateFilter = input.bool(true, title="Filter Date Range of Backtest",
     group="Backtest Time Period")
backtestStartDate = input(timestamp("1 Jan 1997"),
     title="Start Date", group="Backtest Time Period",
     tooltip="This start date is in the time zone of the exchange " +
     "where the chart's instrument trades. It doesn't use the time " +
     "zone of the chart or of your computer.")
backtestEndDate = input(timestamp("1 Sept 2023"),
     title="End Date", group="Backtest Time Period",
     tooltip="This end date is in the time zone of the exchange " +
     "where the chart's instrument trades. It doesn't use the time " +
     "zone of the chart or of your computer.")

// STEP 2. See if the current bar falls inside the date range
inTradeWindow = true

// Bollinger Bands inputs
length = input.int(20, title="Bollinger Bands Length")
mult = input.float(2.0, title="Multiplier")
src = input(close, title="Source")
basis = ta.sma(src, length)
dev = mult * ta.stdev(src, length)
upper = basis + dev
lower = basis - dev

// EMA Settings
ema20 = ta.ema(close, 20)
plot(ema20, color=color.blue, title="20 EMA")

// Entry condition
longEntryCondition = ta.crossover(close, lower)

// Define stop loss level as the low of the entry bar
var float stopLossPrice = na
if longEntryCondition
    stopLossPrice := low

// Top Bollinger Band itself is set as the target
topBandTarget = upper

// Enter long position when conditions are met
if inTradeWindow and longEntryCondition
    strategy.entry("Long", strategy.long, qty=1)

// Set profit targets
strategy.exit("ProfitTarget2", from_entry="Long", limit=topBandTarget)

// Set stop loss
strategy.exit("StopLoss", stop=stopLossPrice)

// Plot Bollinger Bands with the same gray color
plot(upper, color=color.gray, title="Upper Bollinger Band")
plot(lower, color=color.gray, title="Lower Bollinger Band")