Strategi divergensi berbasis rata-rata bergerak


Tanggal Pembuatan: 2024-01-24 11:43:41 Akhirnya memodifikasi: 2024-01-24 11:43:41
menyalin: 1 Jumlah klik: 651
1
fokus pada
1617
Pengikut

Strategi divergensi berbasis rata-rata bergerak

Ringkasan

Strategi ini bekerja dengan menghitung Moving Average dan pivot point-nya, dan menemukan deviasi antara harga dan Moving Average, sebagai sinyal untuk membeli dan menjual. Ini dapat diterapkan pada indikator osilasi apa pun untuk menemukan deviasi. Ini adalah alat yang berharga yang dapat digunakan untuk retrospeksi dan perdagangan langsung.

Prinsip Strategi

  1. Penghitungan panjang adalah Moving Average of Len (MA)
  2. Deteksi MA pada titik pivotal rendah (PL) dan titik pivotal tinggi (PH)
  3. Penilaian apakah ada deviasi positif: harga menginovasi low point dan MA tidak menginovasi low atau harga tidak menginovasi low point dan MA menginovasi low
  4. Periksa apakah ada reversal deviasi: harga inovasi tinggi dan MA tidak inovasi tinggi atau harga tidak inovasi tinggi dan MA inovasi tinggi
  5. Membeli dan menjual berdasarkan situasi yang berbeda

Analisis Keunggulan

  1. Dapat secara otomatis mendeteksi deviasi antara harga dan MA, menghindari kesalahan penilaian manual
  2. Dapat diterapkan pada indikator osilasi apa pun, sangat ekspansif
  3. Dapat digunakan untuk mengevaluasi kembali profitabilitas strategi
  4. Parameter yang dapat dikonfigurasi menyesuaikan sensitivitas untuk menghindari sinyal yang salah
  5. Berbagai jenis deviasi, penilaian yang akurat dan komprehensif

Analisis risiko

  1. Jika indikator osilasi tidak diatur dengan benar, dapat menghasilkan banyak sinyal yang salah
  2. Pembagian dari titik pusat yang diperlukan sebelum terjadi, kemungkinan kurangnya sinyal
  3. Parameter harus disesuaikan untuk menyeimbangkan sensitivitas dengan sinyal kesalahan penyaringan
  4. Lebih efektif bila dikombinasikan dengan faktor-faktor lain, dan kurang dapat diandalkan bila digunakan sendiri

Arah optimasi

  1. Mengoptimalkan parameter moving average untuk mencari kombinasi parameter yang optimal
  2. Gabungan dengan indikator lain seperti indikator harga dan kuantitas untuk menghindari sinyal yang salah
  3. Menambahkan penilaian model pembelajaran mesin jauh dari kepercayaan
  4. Meningkatkan mekanisme manajemen risiko untuk mengendalikan kerugian tunggal

Meringkaskan

Strategi ini dapat mengotomatiskan penilaian dan menghindari kesalahan subjektif dengan mendeteksi perbedaan antara harga dan rata-rata bergerak sebagai sinyal perdagangan. Ini dapat diterapkan secara luas pada indikator osilasi apa pun dan memiliki skalabilitas yang kuat.

Kode Sumber Strategi
/*backtest
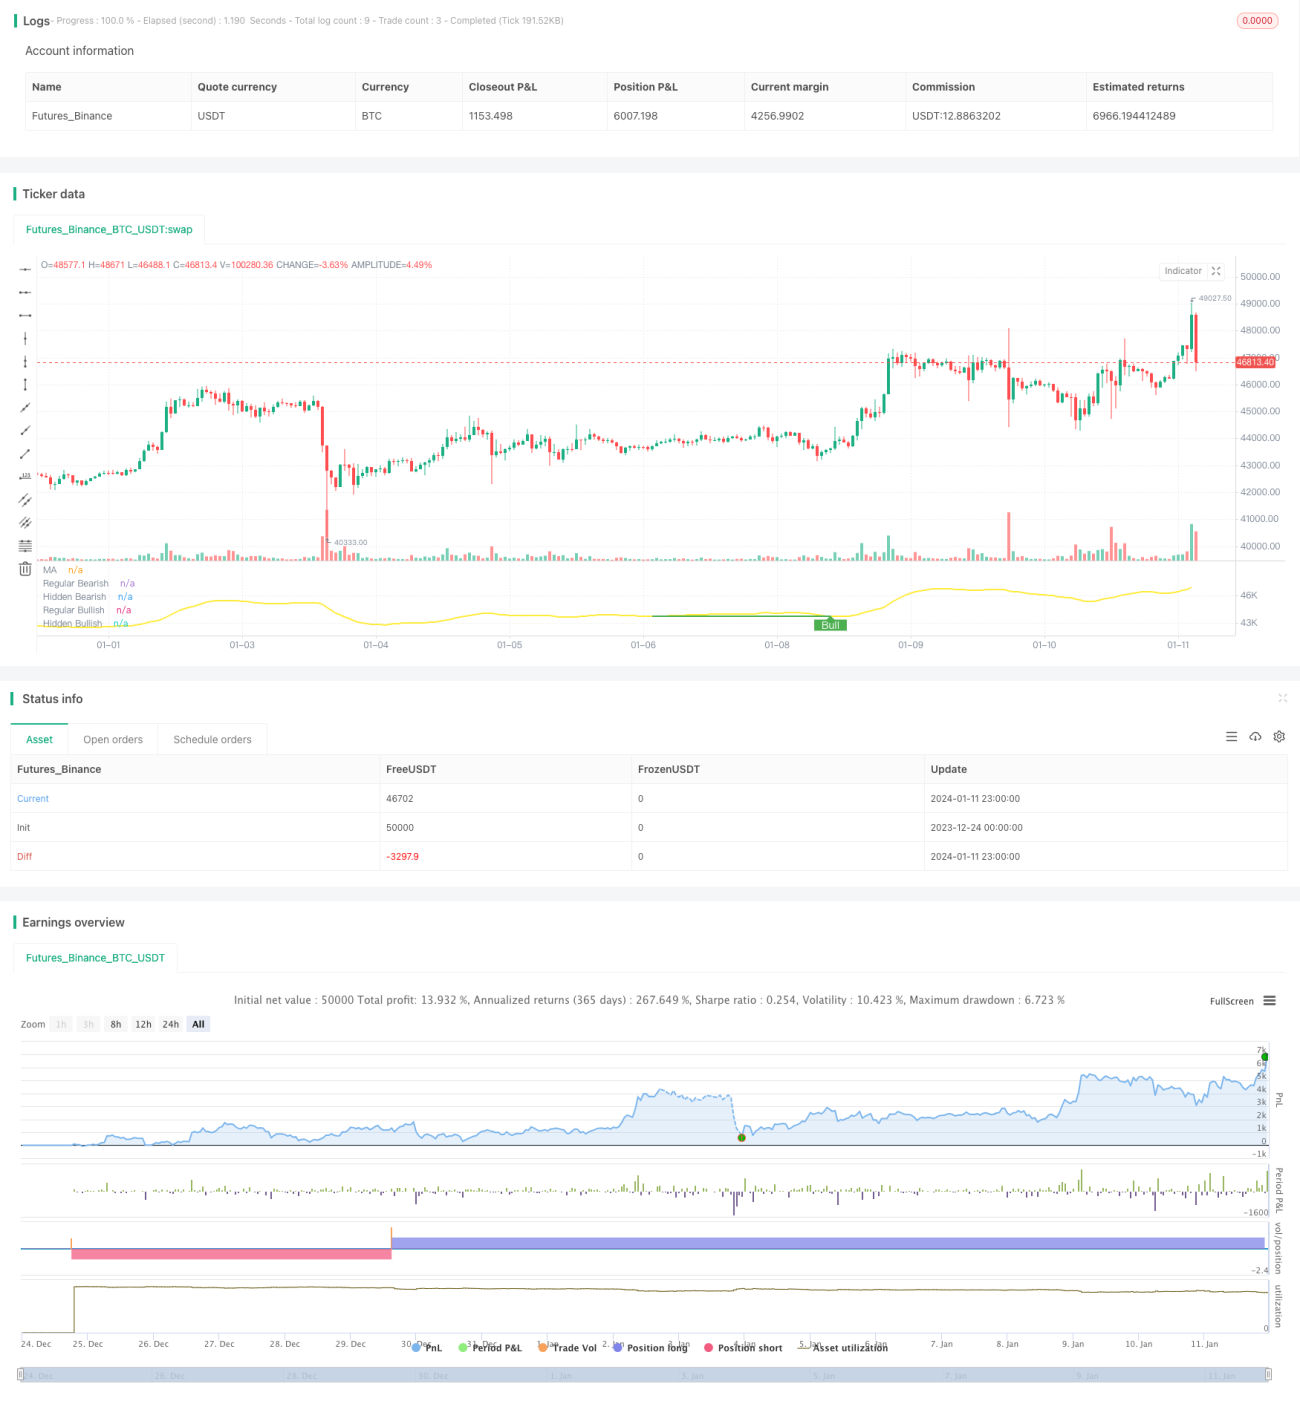
start: 2023-12-24 00:00:00
end: 2024-01-12 00:00:00
period: 1h
basePeriod: 15m
exchanges: [{"eid":"Futures_Binance","currency":"BTC_USDT"}]
*/

// This source code is subject to the terms of the Mozilla Public License 2.0 at https://mozilla.org/MPL/2.0/
// © tista 
//https://www.tradingview.com/u/tista/#published-scripts

//@version=4

strategy(title="MA Divergences", format=format.price)

//* Backtesting Period Selector | Component *//
//* https://www.tradingview.com/script/eCC1cvxQ-Backtesting-Period-Selector-Component *//
//* https://www.tradingview.com/u/pbergden/ *//
//* Modifications made *//
testStartYear = input(2021, "Backtest Start Year") 
testStartMonth = input(1, "Backtest Start Month")
testStartDay = input(1, "Backtest Start Day")
testPeriodStart = timestamp(testStartYear,testStartMonth,testStartDay,0,0)

testStopYear = input(999999, "Backtest Stop Year")
testStopMonth = input(9, "Backtest Stop Month")
testStopDay = input(26, "Backtest Stop Day")
testPeriodStop = timestamp(testStopYear,testStopMonth,testStopDay,0,0)

testPeriod() => true
/////////////// END - Backtesting Period Selector | Component ///////////////
len = input(title="MA Period", minval=1, defval=14)
src = input(title="MA Source", defval=close)
lbR = input(title="Pivot Lookback Right", defval=5)
lbL = input(title="Pivot Lookback Left", defval=5)
rangeUpper = input(title="Max of Lookback Range", defval=600)
rangeLower = input(title="Min of Lookback Range", defval=2)
plotBull = input(title="Plot Bullish", defval=true)
plotHiddenBull = input(title="Plot Hidden Bullish", defval=true)
plotBear = input(title="Plot Bearish", defval=true)
plotHiddenBear = input(title="Plot Hidden Bearish", defval=true)

bearColor = color.red
bullColor = color.green
hiddenBullColor = color.green
hiddenBearColor = color.red
textColor = color.white
noneColor = color.new(color.white, 100)

osc = wma(src, len)

plot(osc, title="MA", linewidth=2, color=color.yellow)

plFound = na(pivotlow(osc, lbL, lbR)) ? false : true
phFound = na(pivothigh(osc, lbL, lbR)) ? false : true

_inRange(cond) =>
    bars = barssince(cond == true)
    rangeLower <= bars and bars <= rangeUpper

alertcondition(osc[1] > 100.0 and osc[2] < 100.0, title="MA value crosses over 100.0", message="Check charts for a MA cross over 100.0")
alertcondition(osc[1] < 100.0 and osc[2] > 100.0, title="MA value crosses under 100.0", message="Check charts for a MA cross under 100.0")
alertcondition(osc[1] > -100. and osc[2] < -100.0, title="MA value crosses over -100.0", message="Check charts for a MA cross over -100.0")
alertcondition(osc[1] < -100.0 and osc[2] > -100.0, title="MA value crosses under -100.0", message="Check charts for a MA cross under -100.0")

//------------------------------------------------------------------------------
// Regular Bullish

// Osc: Higher Low
oscHL = osc[lbR] > valuewhen(plFound, osc[lbR], 1) and _inRange(plFound[1])

// Price: Lower Low
priceLL = low[lbR] < valuewhen(plFound, low[lbR], 1)

bullCond = plotBull and priceLL and oscHL and plFound

plot(
	 plFound ? osc[lbR] : na,
	 offset=-lbR,
	 title="Regular Bullish",
	 linewidth=2,
	 color=(bullCond ? bullColor : noneColor),
	 transp=0
	 )

plotshape(
	 bullCond ? osc[lbR] : na,
	 offset=-lbR,
	 title="Regular Bullish Label",
	 text=" Bull ",
	 style=shape.labelup,
	 location=location.absolute,
	 color=bullColor,
	 textcolor=textColor,
	 transp=0
	 )

alertcondition(bullCond, title="Regular bullish divergence in MA found", message="Check charts for a regular bullish divergence found with MA")

//------------------------------------------------------------------------------
// Hidden Bullish

// Osc: Lower Low
oscLL = osc[lbR] < valuewhen(plFound, osc[lbR], 1) and _inRange(plFound[1])

// Price: Higher Low
priceHL = low[lbR] > valuewhen(plFound, low[lbR], 1)

hiddenBullCond = plotHiddenBull and priceHL and oscLL and plFound

plot(
	 plFound ? osc[lbR] : na,
	 offset=-lbR,
	 title="Hidden Bullish",
	 linewidth=2,
	 color=(hiddenBullCond ? hiddenBullColor : noneColor),
	 transp=0
	 )

plotshape(
	 hiddenBullCond ? osc[lbR] : na,
	 offset=-lbR,
	 title="Hidden Bullish Label",
	 text=" H Bull ",
	 style=shape.labelup,
	 location=location.absolute,
	 color=bullColor,
	 textcolor=textColor,
	 transp=0
	 )

alertcondition(hiddenBullCond, title="Hidden bullish divergence in MA found", message="Check charts for a hidden bullish divergence found with MA")

//------------------------------------------------------------------------------
// Regular Bearish

// Osc: Lower High
oscLH = osc[lbR] < valuewhen(phFound, osc[lbR], 1) and _inRange(phFound[1])

// Price: Higher High
priceHH = high[lbR] > valuewhen(phFound, high[lbR], 1)

bearCond = plotBear and priceHH and oscLH and phFound

plot(
	 phFound ? osc[lbR] : na,
	 offset=-lbR,
	 title="Regular Bearish",
	 linewidth=2,
	 color=(bearCond ? bearColor : noneColor),
	 transp=0
	 )

plotshape(
	 bearCond ? osc[lbR] : na,
	 offset=-lbR,
	 title="Regular Bearish Label",
	 text=" Bear ",
	 style=shape.labeldown,
	 location=location.absolute,
	 color=bearColor,
	 textcolor=textColor,
	 transp=0
	 )

alertcondition(bearCond, title="Regular bearish divergence in MA found", message="Check charts for a regular bearish divergence found with MA")

//------------------------------------------------------------------------------
// Hidden Bearish

// Osc: Higher High
oscHH = osc[lbR] > valuewhen(phFound, osc[lbR], 1) and _inRange(phFound[1])

// Price: Lower High
priceLH = high[lbR] < valuewhen(phFound, high[lbR], 1)

hiddenBearCond = plotHiddenBear and priceLH and oscHH and phFound

plot(
	 phFound ? osc[lbR] : na,
	 offset=-lbR,
	 title="Hidden Bearish",
	 linewidth=2,
	 color=(hiddenBearCond ? hiddenBearColor : noneColor),
	 transp=0
	 )

plotshape(
	 hiddenBearCond ? osc[lbR] : na,
	 offset=-lbR,
	 title="Hidden Bearish Label",
	 text=" H Bear ",
	 style=shape.labeldown,
	 location=location.absolute,
	 color=bearColor,
	 textcolor=textColor,
	 transp=0
	 )

// Alerts
//alertcondition(bearCond or hiddenBearCond, title='Bear div', message='Bear div')
//alertcondition(bullCond or hiddenBullCond, title='Bull div', message='Bull div')
//alertcondition(bearCond or bullCond, title='Bull or beal div', message='Bull or bear div') 
//alertcondition(hiddenBearCond or hiddenBullCond, title='Bull or beal div', message='Hidden Bull or bear div') 
//alertcondition(hiddenBearCond or hiddenBullCond or bearCond or bullCond, title='Bull or beal div', message='Any Bull or bear div') 

if testPeriod()
    if bullCond or hiddenBullCond
        strategy.entry("Buy", strategy.long)
    if bearCond or hiddenBearCond
        strategy.entry("Sell", strategy.short)