Strategi perdagangan skillet intraday berdasarkan EMA
Ringkasan
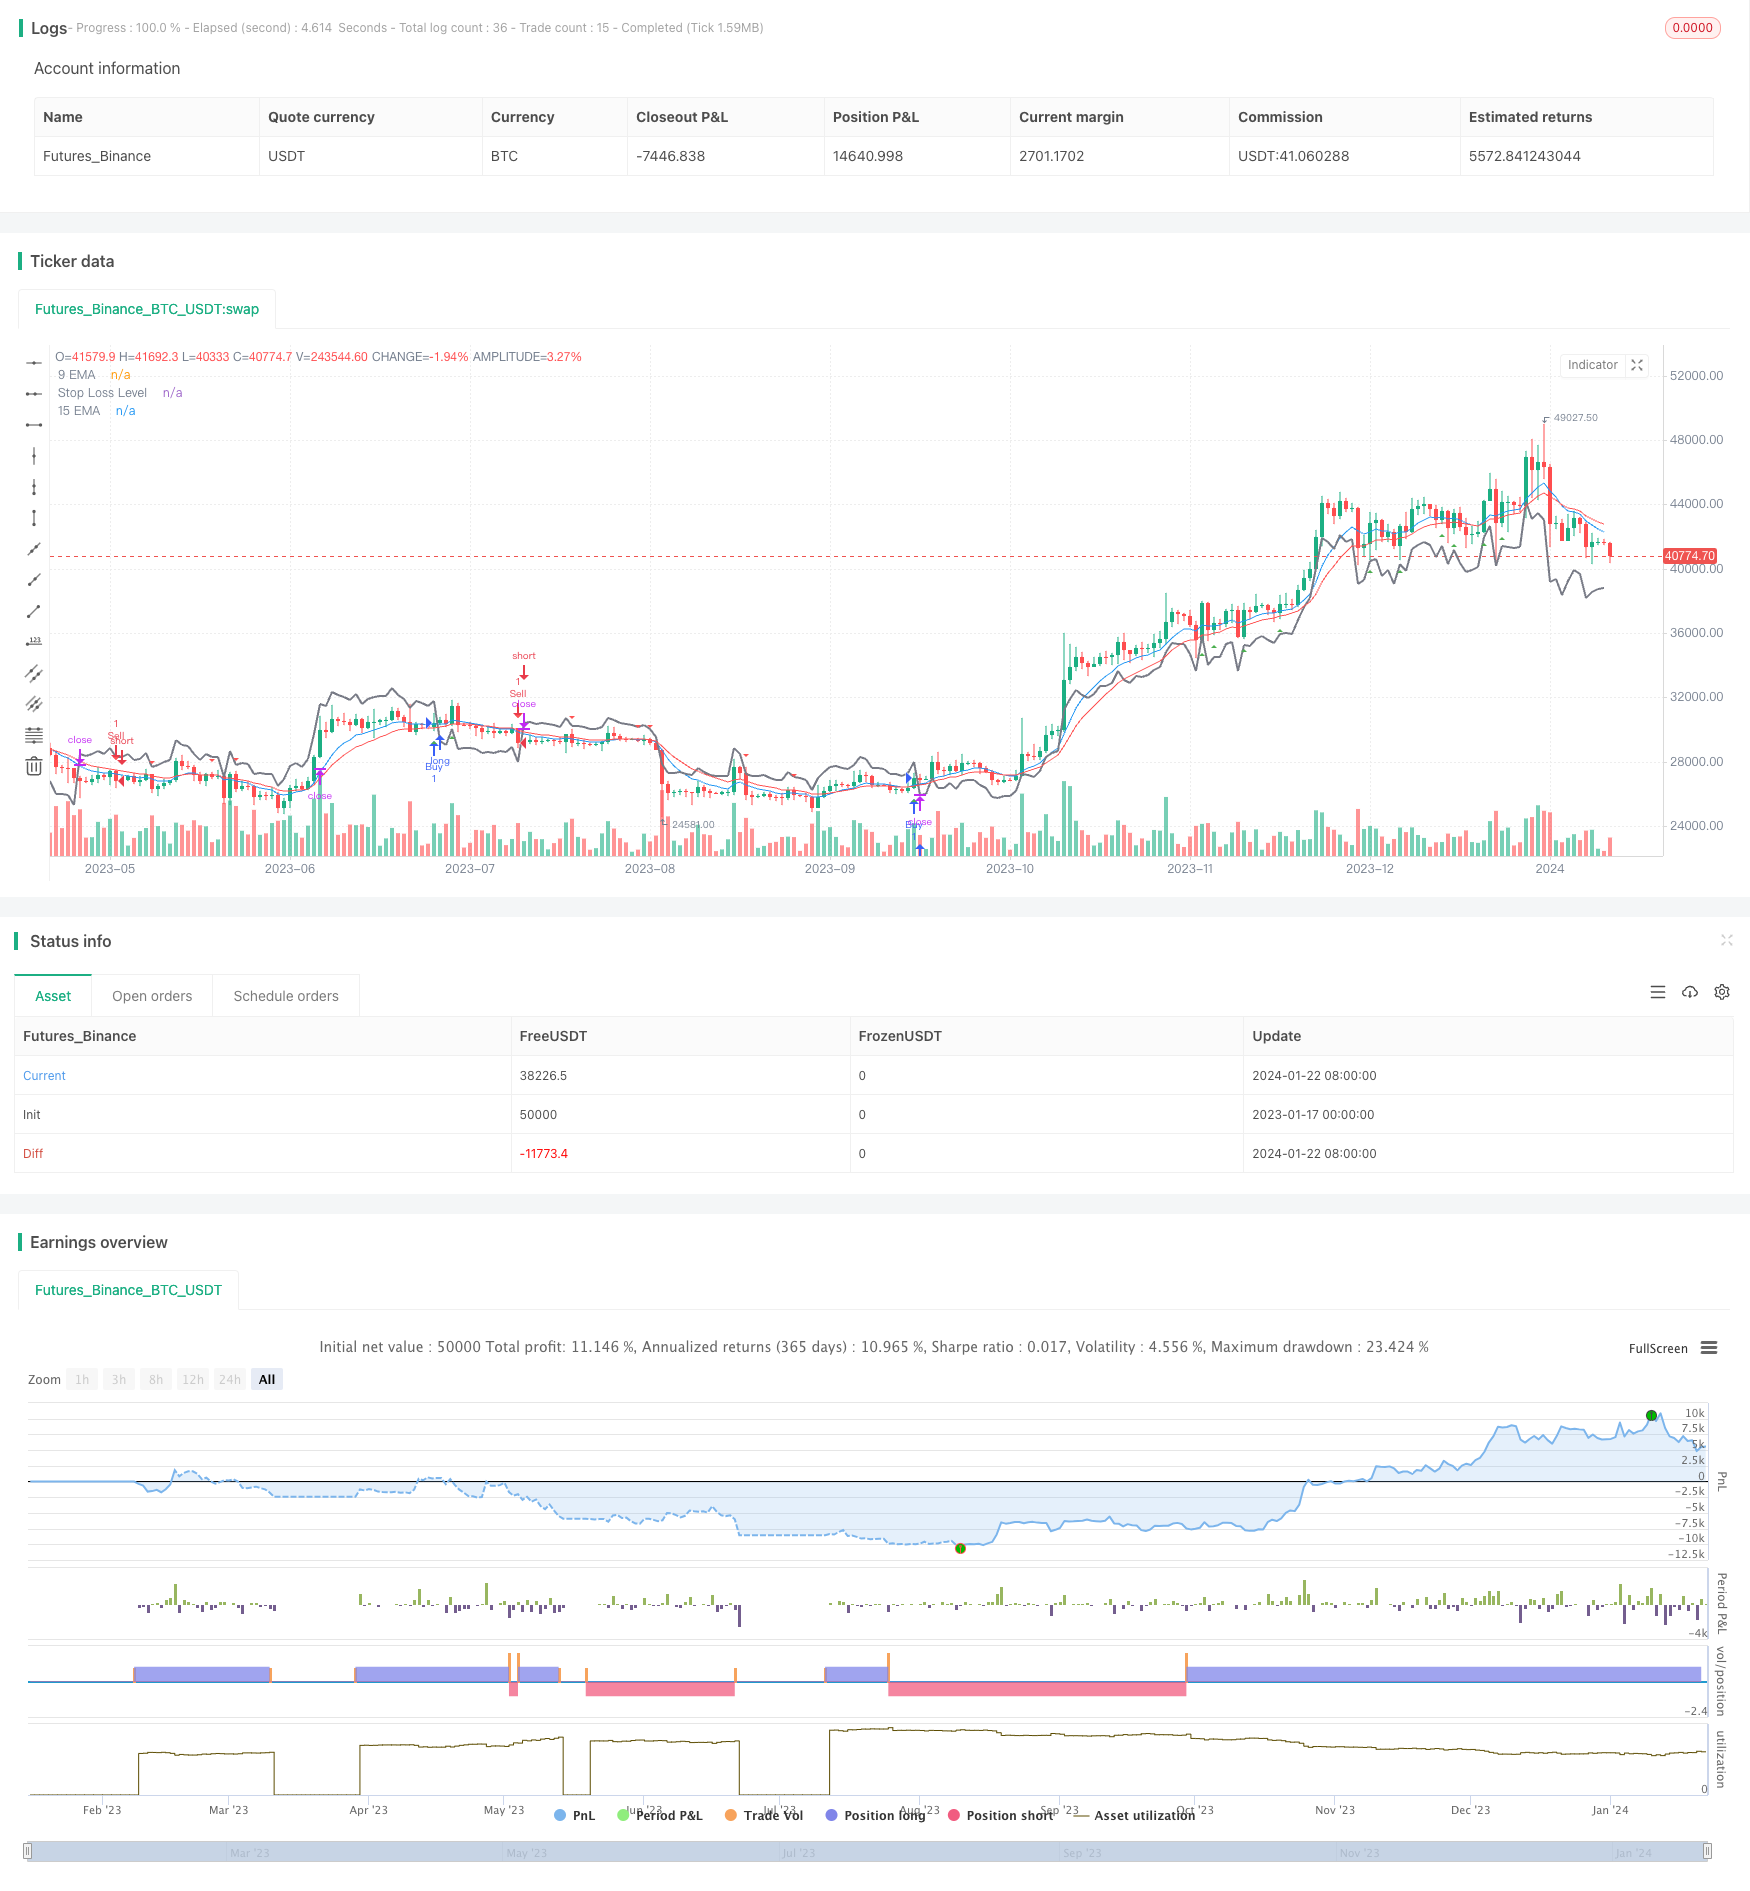
Strategi ini digunakan untuk perdagangan short-line dalam satu hari. Strategi ini menghasilkan sinyal beli ketika 9EMA berlawanan dengan 15EMA dan garis K yang paling dekat adalah garis positif. Strategi ini menghasilkan sinyal jual ketika 9EMA berlawanan dengan 15EMA dan garis K yang paling dekat adalah garis negatif. Strategi ini juga menggabungkan indikator ATR untuk memetakan garis stop loss.
Prinsip Strategi
- 9 hari EMA dan 15 EMA
- Mengidentifikasi sifat jatuh dari garis K yang paling dekat, untuk menentukan apakah itu garis positif atau negatif
- Ketika 9 EMA melewati 15 EMA, dan satu garis K yang paling dekat adalah garis yangar, menghasilkan sinyal beli
- Ketika 9 EMA melewati 15 EMA, dan satu garis K yang paling dekat adalah garis negatif, menghasilkan sinyal jual
- Menghitung nilai ATR dengan indikator ATR, menggambar garis stop loss saat memegang posisi
Analisis Keunggulan
Strategi ini memiliki keuntungan sebagai berikut:
- Menggunakan kombinasi dua indikator EMA untuk menangkap tren jangka pendek dan menengah
- Tergabung dengan K-line entitas arah filter sinyal palsu
- Dengan ATR, Anda dapat mengontrol risiko dengan mengamankan keuntungan
- Siklus waktu yang singkat, cocok untuk memanfaatkan fluktuasi harga garis pendek untuk perdagangan skillet dalam sehari
- Operasi sederhana dan mudah diterapkan
Analisis risiko
Strategi ini juga memiliki beberapa risiko:
- Indikator EMA memiliki keterlambatan dan mungkin melewatkan beberapa pergerakan harga
- Regresi rata-rata EMA ganda dapat menghasilkan sinyal whipsaws
- Transaksi singkat dalam sehari rentan terhadap perubahan harga
- Stop loss yang terlalu kecil akan mudah untuk ditembus, dan yang terlalu besar akan mempengaruhi margin keuntungan.
Tanggapan:
- Menyesuaikan parameter EMA, mempersingkat siklus rata-rata
- Kombinasi dengan indikator lain seperti MACD dan sinyal penyaringan
- Mengubah jarak stop loss secara dinamis dan mengoptimalkan strategi stop loss
Arah optimasi
Strategi ini dapat dioptimalkan dalam beberapa hal:
- Uji kombinasi parameter EMA yang berbeda untuk mencari periode rata-rata yang optimal
- Menambahkan penilaian indikator lainnya, membangun model multi-faktor
- Filter berjangka waktu, hanya mengirimkan sinyal dalam jangka waktu tertentu
- Kombinasi dengan indikator volatilitas, untuk menyesuaikan jarak stop loss
- Parameter pengoptimalan dinamis menggunakan teknologi pembelajaran mesin
Meringkaskan
Strategi ini mengintegrasikan dua indikator EMA untuk menentukan arah tren dan sinyal filter entitas K-line, menggunakan stop loss dinamis ATR, dan merupakan strategi perdagangan yang mudah dan praktis dalam sehari. Dengan pengoptimalan parameter dan kombinasi multi-faktor, stabilitas dan profitabilitas strategi dapat ditingkatkan lebih lanjut.
/*backtest
start: 2023-01-17 00:00:00
end: 2024-01-23 00:00:00
period: 1d
basePeriod: 1h
exchanges: [{"eid":"Futures_Binance","currency":"BTC_USDT"}]
*/

//@version=5
strategy("EMA Scalping Strategy", shorttitle="EMAScalp", overlay=true)

// Input parameters
ema9_length = input(9, title="9 EMA Length")
ema15_length = input(15, title="15 EMA Length")

// Calculate EMAs
ema9 = ta.ema(close, ema9_length)
ema15 = ta.ema(close, ema15_length)

// Plot EMAs on the chart
plot(ema9, color=color.blue, title="9 EMA")
plot(ema15, color=color.red, title="15 EMA")

// Identify Bullish and Bearish candles
bullish_candle = close > open
bearish_candle = close < open

// Bullish conditions for Buy Signal
buy_condition = ta.crossover(close, ema9) and ema15 < ema9 and bullish_candle

// Bearish conditions for Sell Signal
sell_condition = ta.crossunder(close, ema9) and ema15 > ema9 and bearish_candle

// Plot Buy and Sell signals
plotshape(series=buy_condition, title="Buy Signal", color=color.green, style=shape.triangleup, location=location.belowbar)
plotshape(series=sell_condition, title="Sell Signal", color=color.red, style=shape.triangledown, location=location.abovebar)

// Optional: Add stop-loss levels
atr_length = input(14, title="ATR Length for Stop Loss")
atr_multiplier = input(1.5, title="ATR Multiplier for Stop Loss")

atr_value = ta.atr(atr_length)
stop_loss_level = strategy.position_size > 0 ? close - atr_multiplier * atr_value : close + atr_multiplier * atr_value
plot(stop_loss_level, color=color.gray, title="Stop Loss Level", linewidth=2)

// Strategy rules
if (buy_condition)
    strategy.entry("Buy", strategy.long)
    strategy.exit("Exit Buy", from_entry="Buy", loss=stop_loss_level)

if (sell_condition)
    strategy.entry("Sell", strategy.short)
    strategy.exit("Exit Sell", from_entry="Sell", loss=stop_loss_level)