Strategi perdagangan BTC berdasarkan rata-rata pergerakan EMA dan indikator MACD
Ringkasan
Strategi ini adalah strategi gabungan berdasarkan EMA Mean Line Difference dan MACD Indicator untuk shorting BTC. Strategi ini menggabungkan sinyal EMA Mean Line dan MACD untuk menghasilkan sinyal beli dan jual dalam kondisi tertentu.
Prinsip Strategi
Sebuah sinyal beli dihasilkan ketika selisih adalah negatif, dan lebih kecil dari batas, dan MACD muncul di atas silang kosong. Sebuah sinyal jual dihasilkan ketika selisih adalah positif, dan lebih besar dari batas, dan MACD muncul di atas silang ganda.
Dengan menggunakan kombinasi EMA dan MACD, beberapa sinyal palsu dapat disaring dan meningkatkan keandalan sinyal.
Analisis Keunggulan
- Dengan menggunakan indikator komposit, sinyal lebih dapat diandalkan
- Pengaturan dengan parameter periode pendek, cocok untuk perdagangan garis pendek
- Pengaturan Stop Loss dan Stop Stop untuk Mengontrol Risiko
Analisis risiko
- Stop loss dapat dihancurkan saat pasar bergejolak
- Parameter yang perlu dioptimalkan agar lebih sesuai dengan lingkungan pasar yang berbeda
- Perlu menguji berbagai mata uang dan berbagai bursa
Arah optimasi
- Optimalkan parameter EMA dan MACD agar lebih sesuai dengan lingkungan fluktuasi BTC
- Meningkatkan posisi terbuka dan strategi penurunan posisi, mengoptimalkan efisiensi penggunaan dana
- Meningkatkan metode stop loss, seperti stop loss bergerak, stop loss bergoyang, dan lain-lain, untuk mengurangi risiko
- Uji coba berbagai bursa dan mata uang
Meringkaskan
Strategi ini mengintegrasikan keunggulan dari kedua indikator, garis rata-rata dan MACD, menggunakan sinyal komposit, yang dapat secara efektif memfilter sinyal palsu. Dengan optimasi parameter dan strategi pembukaan posisi, keuntungan yang stabil dapat diperoleh. Namun, juga perlu waspada terhadap risiko stop loss yang akan dirobek, perlu pengujian dan perbaikan lebih lanjut.
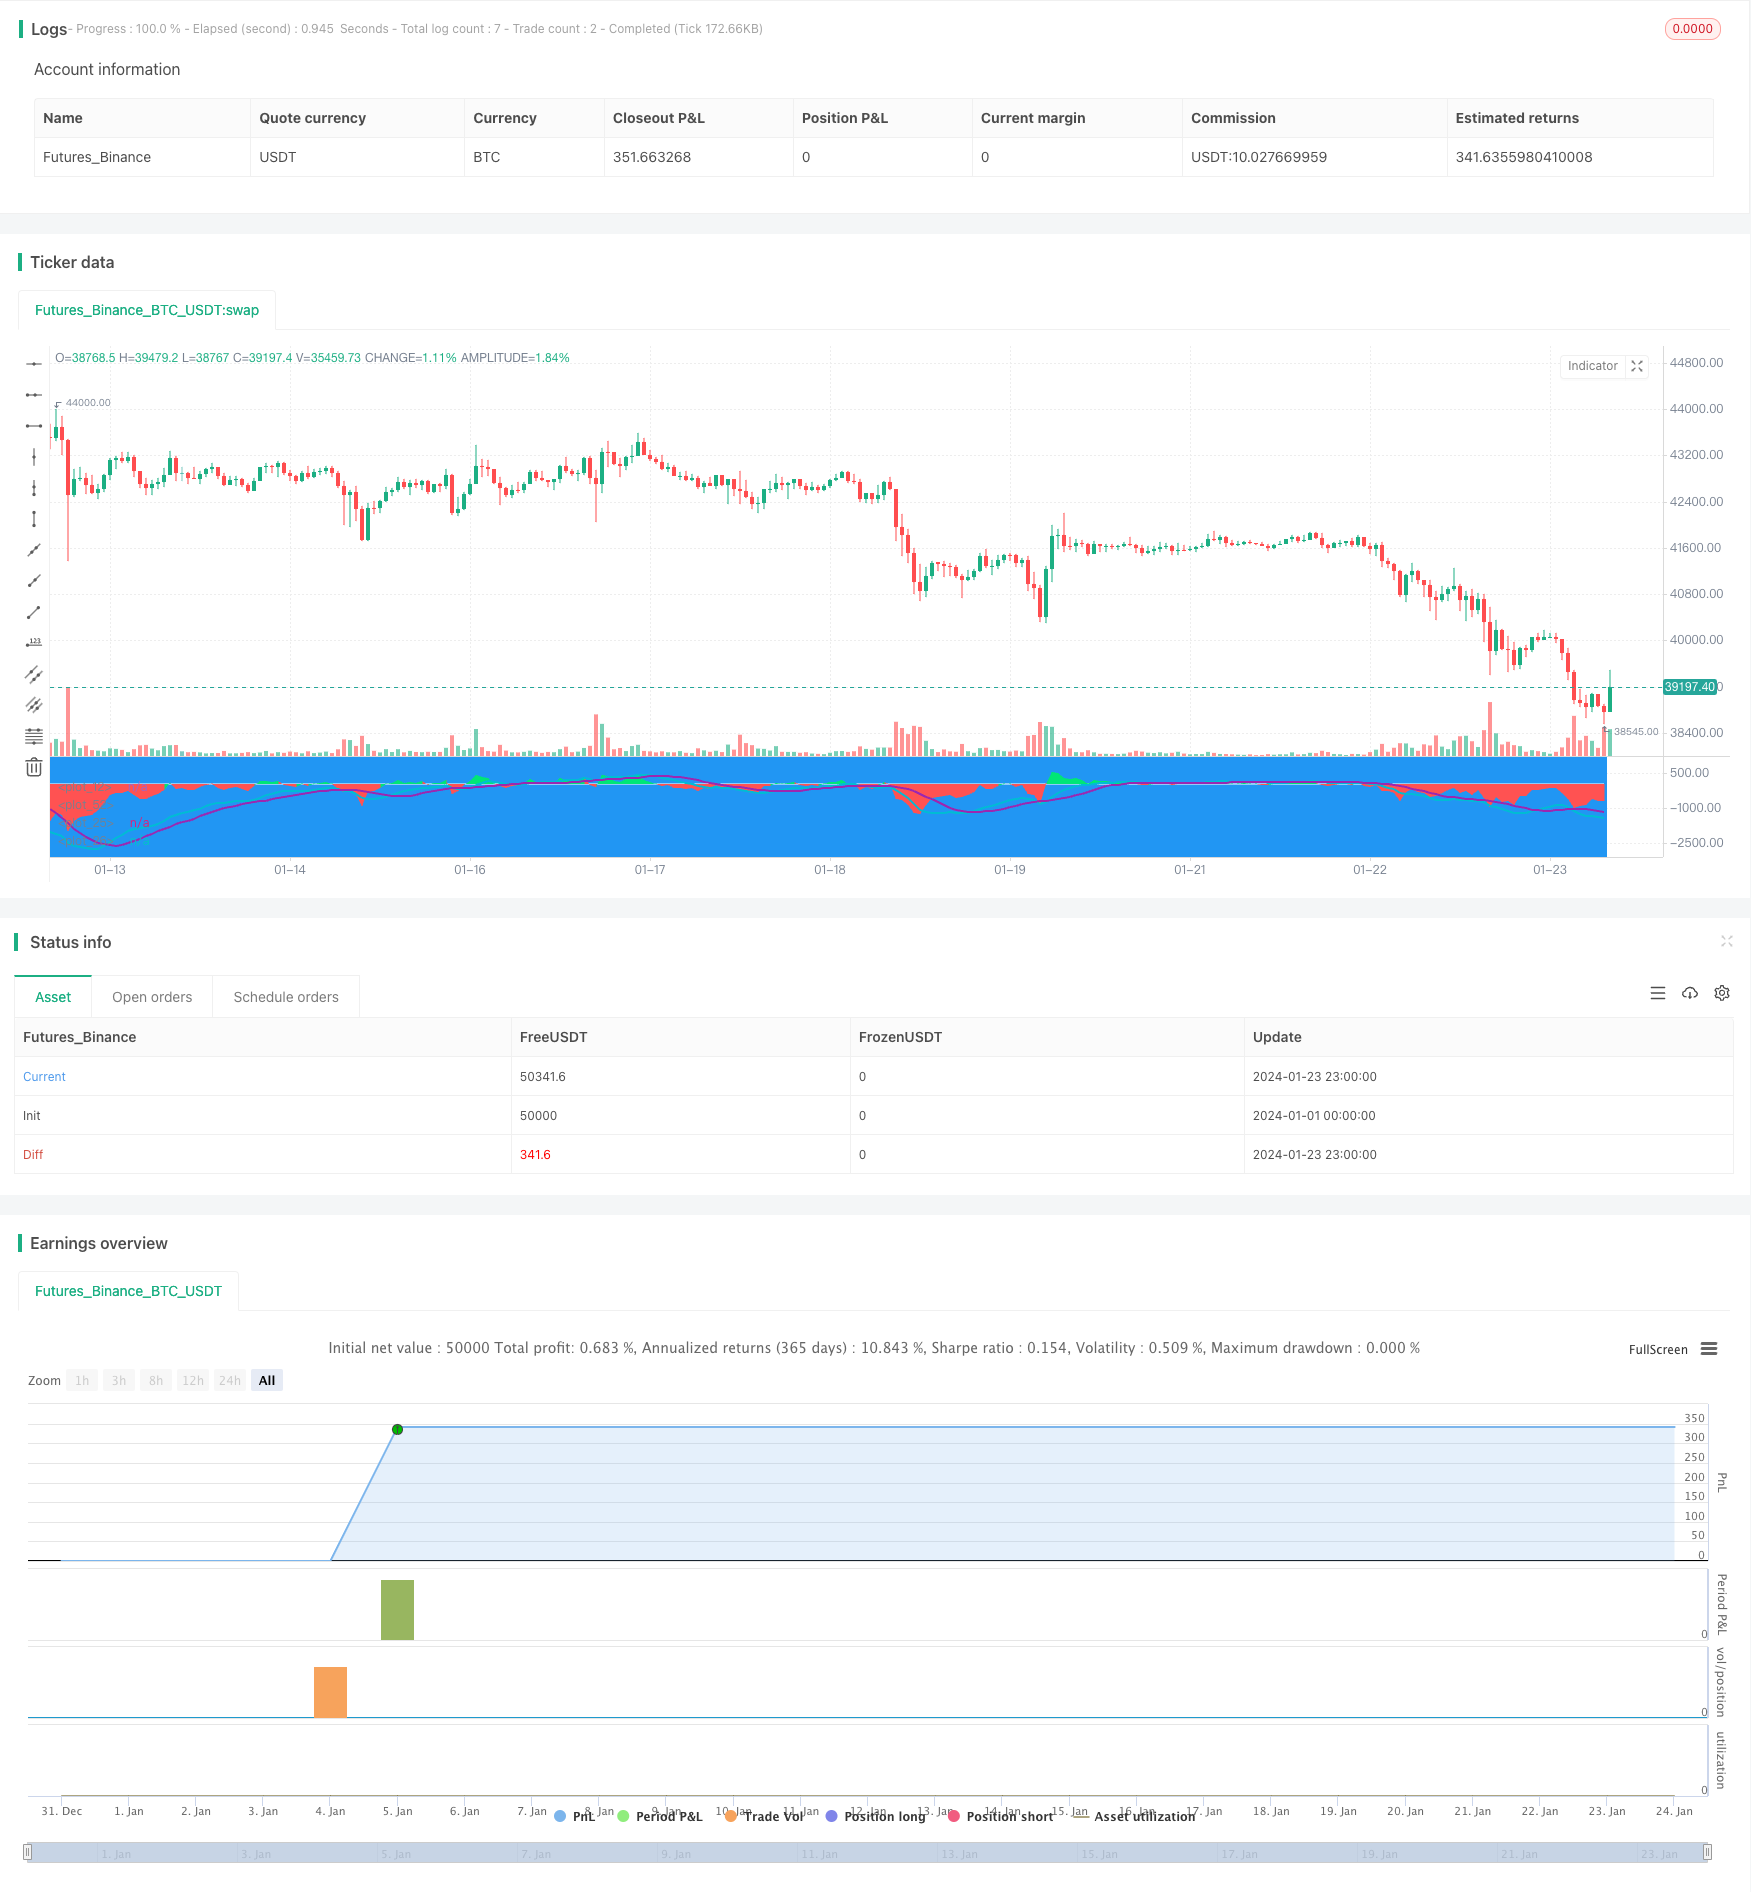
/*backtest
start: 2024-01-01 00:00:00
end: 2024-01-24 00:00:00
period: 1h
basePeriod: 15m
exchanges: [{"eid":"Futures_Binance","currency":"BTC_USDT"}]
*/

//@version=3
strategy("EMA50Diff & MACD Strategy", overlay=false)
EMA = input(18, step=1)
MACDfast = input(12)
MACDslow = input(26)
EMADiffThreshold = input(8)
MACDThreshold = input(80)
TargetValidityThreshold = input(65, step=5)
Target = input(120, step=5)
StopLoss = input(650, step=5)
ema = ema(close, EMA)
hl = plot(0, color=white, linewidth=1)
diff = close - ema
clr = color(blue, transp=100)
if diff>0
    clr := lime
else
    if diff<0
        clr := red

fastMA = ema(close, MACDfast)
slowMA = ema(close, MACDslow)
macd = (fastMA - slowMA)*3
signal = sma(macd, 9)
plot(macd, color=aqua, linewidth=2)
plot(signal, color=purple, linewidth=2)

macdlong = macd<-MACDThreshold and signal<-MACDThreshold and crossover(macd, signal)
macdshort = macd>MACDThreshold and signal>MACDThreshold and crossunder(macd, signal)
position = 0.0
position := nz(strategy.position_size, 0.0)
long = (position < 0 and close < strategy.position_avg_price - TargetValidityThreshold and macdlong) or
     (position == 0.0 and diff < -EMADiffThreshold and diff > diff[1] and diff[1] < diff[2] and macdlong)

short = (position > 0 and close > strategy.position_avg_price + TargetValidityThreshold and macdshort) or
      (position == 0.0 and diff > EMADiffThreshold and diff < diff[1] and diff[1] > diff[2] and macdshort)
amount = (strategy.equity / close) //- ((strategy.equity / close / 10)%10)
bgclr = color(blue, transp=100) //#0c0c0c
if long
    strategy.entry("long", strategy.long, amount)
    bgclr := green
if short
    strategy.entry("short", strategy.short, amount)
    bgclr := maroon
bgcolor(bgclr, transp=20)
strategy.close("long", when=close>strategy.position_avg_price + Target)
strategy.close("short", when=close<strategy.position_avg_price - Target)
strategy.exit("STOPLOSS", "long", stop=strategy.position_avg_price - StopLoss)
strategy.exit("STOPLOSS", "short", stop=strategy.position_avg_price + StopLoss)
//plotshape(long, style=shape.labelup, location=location.bottom, color=green)
//plotshape(short, style=shape.labeldown, location=location.top, color=red)
pl = plot(diff, style=histogram, color=clr)
fill(hl, pl, color=clr)