Strategi Perdagangan Golden Cross
Ringkasan
Strategi perdagangan golden cross menggunakan persilangan rata-rata bergerak dari dua periode yang berbeda sebagai sinyal beli dan jual. Secara khusus, ketika rata-rata bergerak periode pendek dari bawah menerobos rata-rata bergerak periode panjang, menghasilkan sinyal silang emas, yang menunjukkan bull; ketika rata-rata bergerak periode pendek dari atas jatuh dari atas dan melanggar rata-rata bergerak periode panjang, menghasilkan sinyal silang mati, yang menunjukkan bear.
Prinsip Strategi
Strategi ini didasarkan pada dua prinsip:
Moving averages dapat mencerminkan tren dan kekuatan pasar. Moving averages jangka pendek dapat menangkap pergerakan dan titik balik pasar terbaru. Moving averages jangka panjang menunjukkan tren utama pasar.
Ketika pergerakan rata-rata jangka pendek dan jangka panjang membentuk persimpangan emas, ini menunjukkan kekuatan pasar jangka pendek melebihi kekuatan tren jangka panjang, sehingga kemungkinan besar akan memulai tren naik baru. Ketika membentuk persimpangan mati, ini menunjukkan dominasi tren turun jangka panjang, sehingga kemungkinan besar akan terus turun.
Secara khusus, strategi ini menetapkan rata-rata bergerak sederhana 13 periode dan 30 periode, dan menghasilkan sinyal perdagangan ketika mereka bersilang. Prinsip persilangan adalah sebagai berikut:
Ketika periode pendek bergerak rata-rata di atas periode panjang bergerak rata-rata, menghasilkan sinyal cross-gold, yang berarti melakukan lebih banyak kesempatan. Pada saat ini, dengan mengevaluasi kecenderungan soliditas masuk: jika harga terus naik lebih dari periode tertentu, yakin saat ini adalah tren naik, maka lakukan lebih banyak.
Ketika pergerakan rata-rata periode pendek melintas di bawah pergerakan rata-rata periode panjang, sinyal silang kematian dihasilkan, yang menunjukkan peluang untuk melakukan shorting. Pada saat ini, masuklah dengan menilai kekuatan tren: jika harga terus turun selama periode tertentu, maka percaya diri saat ini adalah tren turun, maka lakukan shorting.
Evaluasi kekuatan sinyal silang melalui kemiringan rata-rata bergerak. Sinyal silang dianggap cukup kuat untuk masuk hanya jika kemiringan rata-rata bergerak jangka pendek dan jangka panjang lebih besar dari nilai terendah tertentu. Ini menekan gangguan sinyal palsu biasa.
Stop loss ditetapkan menjadi 20% dan stop loss ditetapkan menjadi 100%.
Analisis Keunggulan
Strategi crossover bilateral memiliki keuntungan sebagai berikut:
Ide yang jelas dan sederhana, mudah dipahami dan diterapkan, cocok untuk pemula.
Menggunakan karakteristik harga rata-rata, ada efek penghapusan kebisingan tertentu, untuk menghindari tertipu oleh fluktuasi harga jangka pendek.
Untuk menilai kekuatan tren, hindari melakukan lebih banyak shorting secara mekanis, tetapi dengan penilaian saham besar.
Pendahuluan ini diperkuat dengan adanya faktor kinerjanya pada kemiringan rata-rata bergerak, yang membuat sinyal lebih dapat diandalkan.
Pengoptimalan retrospektif sederhana, hanya perlu menyesuaikan beberapa parameter kunci seperti parameter moving average dan waktu trend berteguh.
Analisis risiko
Strategi ini juga memiliki risiko sebagai berikut:
Garis persimpangan dua rata tetap merupakan sinyal yang tertinggal, tidak dapat memprediksi titik balik dengan sempurna, dan ada beberapa tingkat keterlambatan. Periode rata-rata bergerak harus dipersingkat sesuai, atau digunakan bersama dengan faktor yang dapat memprediksi titik balik.
Sistem perdagangan mekanis mudah terserang secara kolektif, sehingga memperburuk situasi yang berlebihan, sehingga penghentian kerugian atau penghentian tidak efektif. Penghentian kerugian harus diatur menjadi penghentian kerugian tangga, atau intervensi manual yang sesuai.
Tidak bisa menangani situasi getaran dengan baik, sebaiknya hindari varietas yang berulang-ulang melingkar dalam siklus seperti ini, pilih varietas yang jelas arahnya untuk berdagang.
Jendela waktu untuk mengevaluasi kekuatan tren ditetapkan untuk menentukan apakah ada pengaruh besar pada hasil, dan harus diuji berulang kali untuk menentukan nilai optimal.
Arah optimasi
Strategi crossover dapat dioptimalkan dengan:
Menambahkan indikator untuk menilai tren tingkat besar dan menghindari operasi berlawanan. Misalnya, menambahkan posisi garis perbandingan atau garis bulan.
Tambahkan verifikasi volume transaksi, hanya mengirimkan sinyal jika volume transaksi meningkat, untuk menghindari sinyal palsu.
Mengoptimalkan parameter moving average untuk mencari kombinasi periodik yang optimal. Anda dapat mencoba menyesuaikan parameter moving average.
Pertimbangan tambahan, seperti MACD, KD, dan lain-lain, meningkatkan akurasi sinyal.
Pengaturan Stop Loss Staircase untuk pengendalian risiko yang lebih baik
Meringkaskan
Secara keseluruhan, strategi crossover dua garis sejajar adalah ide strategi yang sangat intuitif dan dapat ditafsirkan. Ini menggabungkan karakteristik penghapusan kebisingan dari rata-rata bergerak dengan kemampuan untuk mengenali tren sederhana dalam penilaian silang.
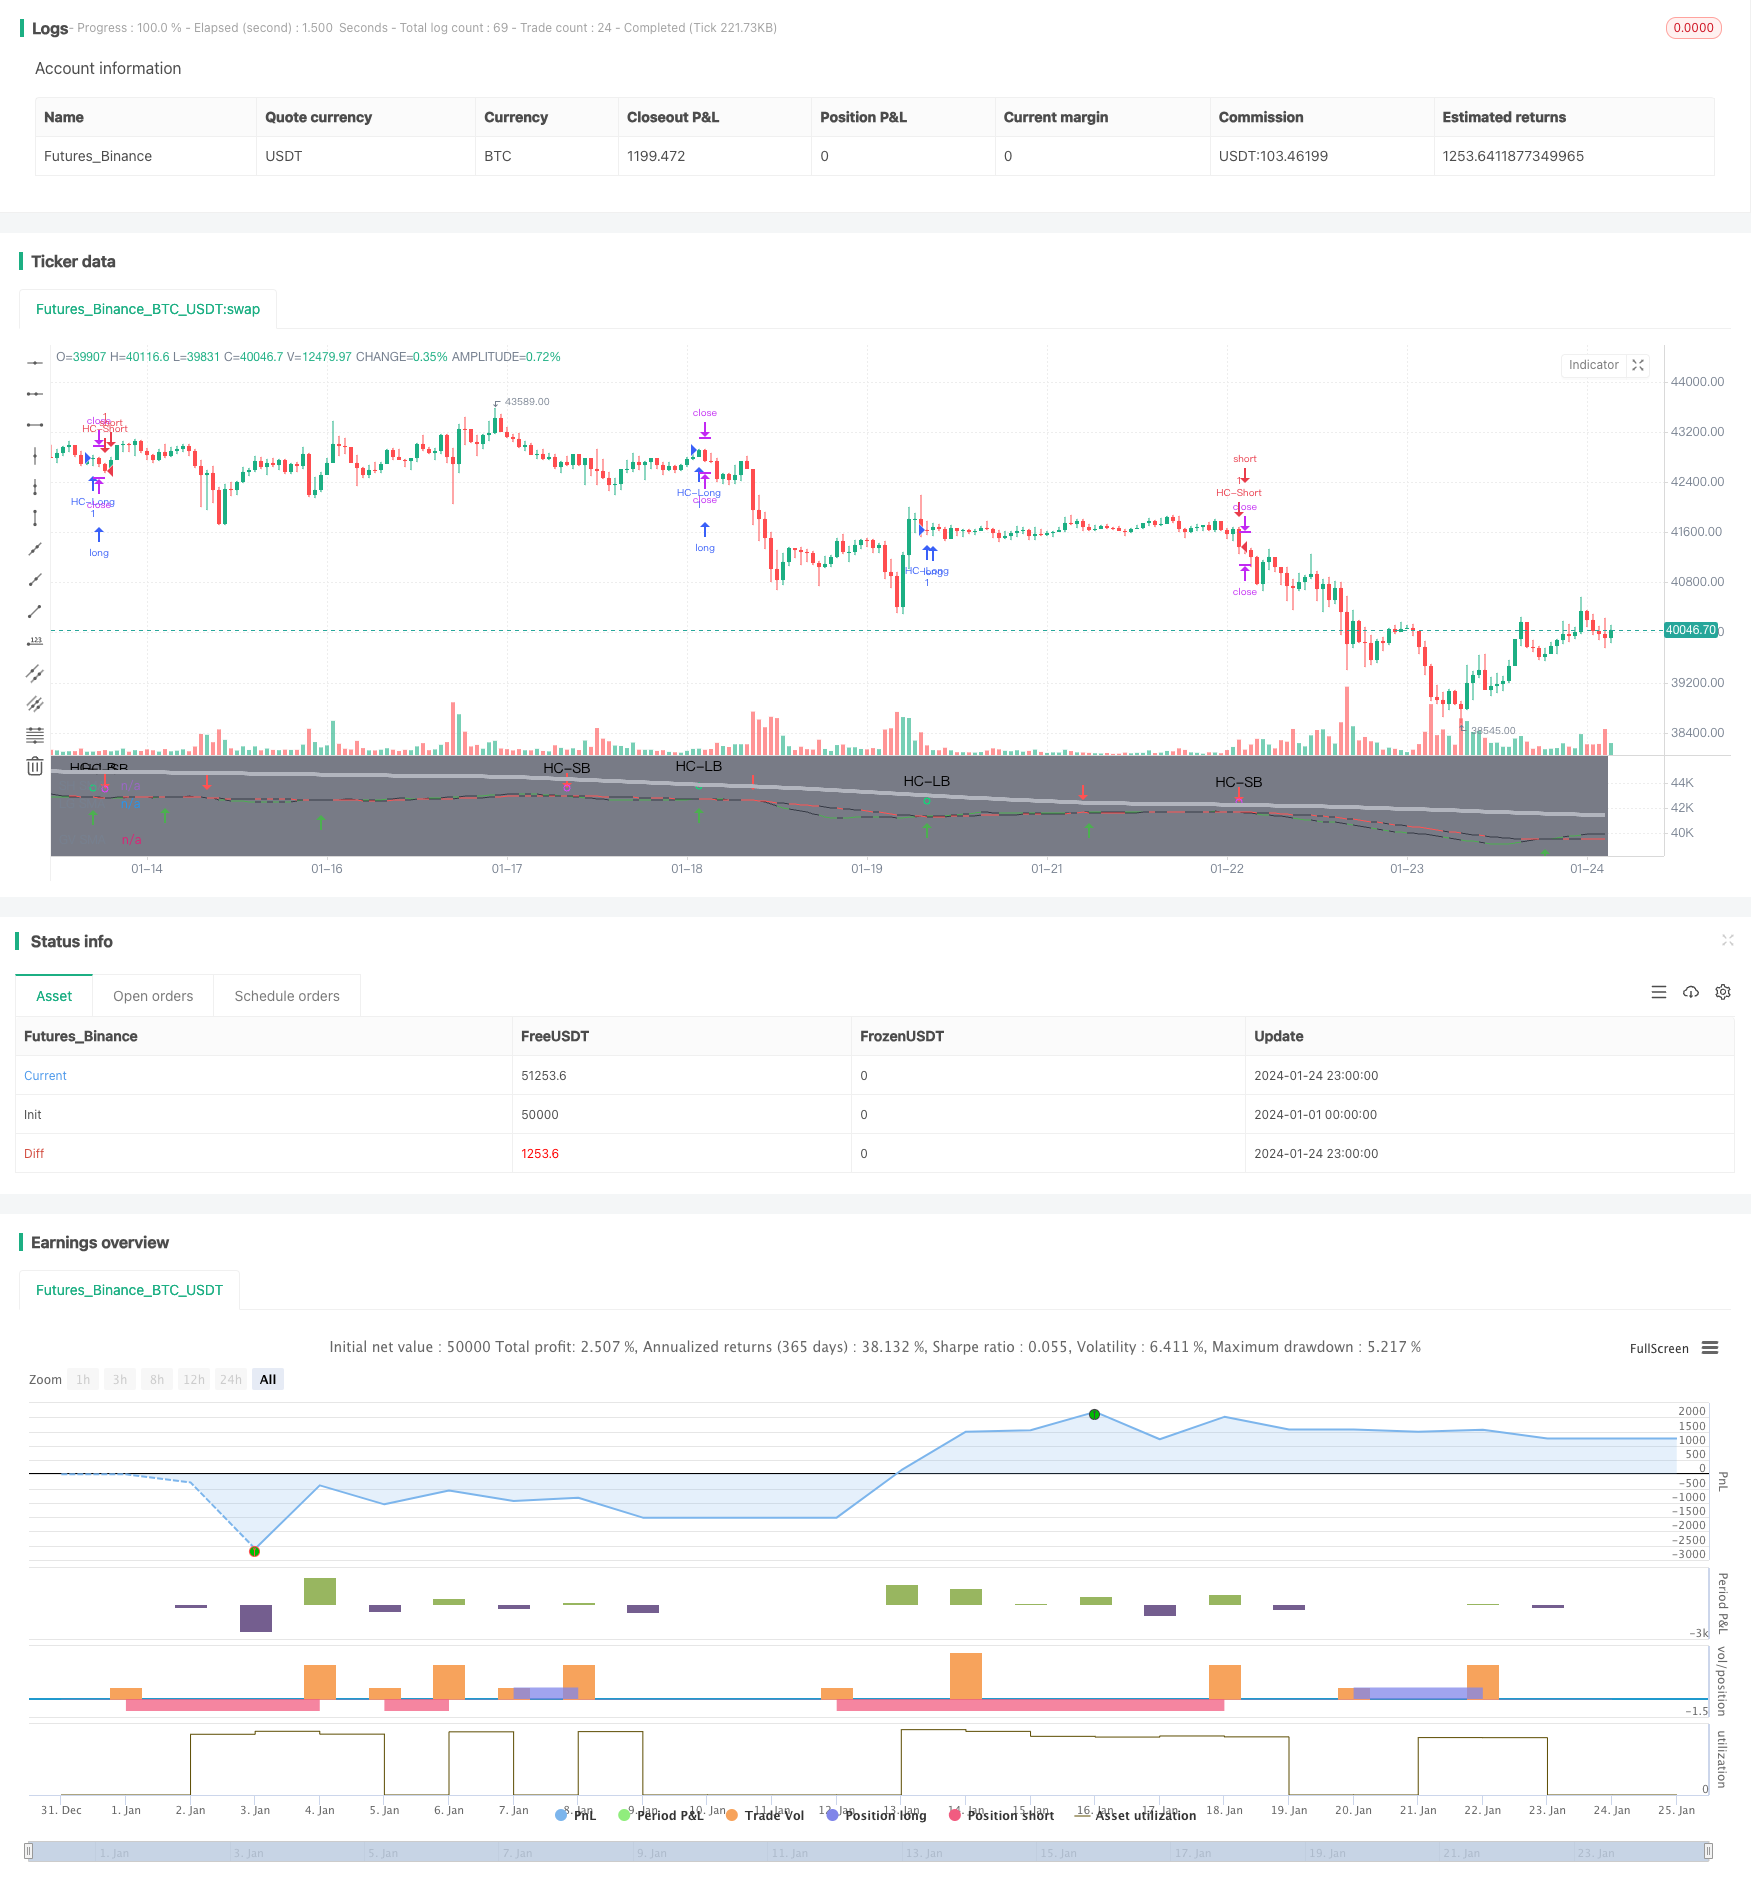
/*backtest
start: 2024-01-01 00:00:00
end: 2024-01-25 00:00:00
period: 1h
basePeriod: 15m
exchanges: [{"eid":"Futures_Binance","currency":"BTC_USDT"}]
*/

//@version=4

// This source code is subject to the terms of the Mozilla Public License 2.0 at https://mozilla.org/MPL/2.0/
// © MakeMoneyCoESTB2020


//*********************Notes for continued work***************

//************************************************************

//Hello my fellow investors
//I am creating a simple non-cluttered strategy that uses 3(+1) simple means to determine: viability, entry, and exit
//1) Has a consistent trend been maintained for several days/weeks
//2) SH SMA crossover LG SMA = Bullish entry/LG SMA crossover SH SMA = Bearish entry
//3) Use the Slope factor & Weeks in Trend (WiT) to dertermine how strong of an entry signal you are comfortable with
//4) Exit position based on next SMA cross and trend reversal or stop loss%
//3+1) For added confidence in trend detection: Apply MACD check - buy--> MACD line above signal line and corssover below histogram \\ sell --> MACD line below signal line and crossover above histogram.
//*)This code also allows you to determine your desired backtesting date compliments of alanaster


//This code is the product of many hours of hard work on the part of the greater tradingview community.  The credit goes to everyone in the community who has put code out there for the greater good.

//Happy Hunting!

// 1. Define strategy settings*************************************************************************************************************************************************************************

//Title
strategy("KISS Strategy: SMA + EMA", shorttitle="KISS Strat")

//define calculations price source
price = input(title="Price Source", defval=close)

// 2. Calculate strategy values*************************************************************************************************************************************************************************

//Calculate 13/30/200SMA
SH_SMA_length= input(title="SH SMA Length", defval=13) //short SMA length
LG_SMA_length= input(title="LG SMA Length", defval=30) //long SMA length
GV_SMA_length= input(title="SH SMA Length", defval=200) //Gravitational SMA length

SH_SMA=sma(price, SH_SMA_length) //short SMA
LG_SMA=sma(price, LG_SMA_length) //long SMA
GV_SMA=sma(price, GV_SMA_length) //gravitational SMA

//calculate MACD
//define variables for speed
fast = 12, slow = 26
//define parameters to calculate MACD
fastMA = ema(price, fast)
slowMA = ema(price, slow)
//define MACD line
macd = fastMA - slowMA
//define SIGNAL line
signal = sma(macd, 9)

//Determine what type of trend we are in
dcp = security(syminfo.tickerid, 'D', close)   //daily close price
wcp = security(syminfo.tickerid, 'W', close)   //weekly close price

WiT = input(title="Weeks In Trend", defval=1, maxval=5, minval=1)    //User input for how many weeks of price action to evaluate (Weeks in Trend = WiT)
BearTrend = false       //initialize trend variables as false
BullTrend = false       //initialize trend variables as false

// BullTrend := (wcp > SH_SMA) and (SH_SMA > LG_SMA)  //true if price is trending up based on weekly price close
// BearTrend := (wcp < SH_SMA) and (SH_SMA < LG_SMA)  //true if price is trending down based on weekly price close


// BullTrend := (price > SH_SMA) and (SH_SMA > LG_SMA)  //true if price is trending up
// BearTrend := (price < SH_SMA) and (SH_SMA < LG_SMA)  //true if price is trending down

//Determine if the market has been in a trend for 'n' weeks

n=WiT                           //create loop internal counting variable
for i=1 to WiT                  //create loop to determine if BearTrend=true to set number of weeks
    if (wcp[n] < price)         //evaluate if BearTrend=false comparing the current price to a paticular week close
        BearTrend := false      //set value to false if older price value is less than newer: trending up
        break                   //break out of for loop when trend first falters
    if (wcp[n] > price)         //evaluate if BearTrend=true comparing the current price to a paticular week close
        BearTrend := true       //set value to true if older price value is greater than newer: trending down
    n:=n-1                      //set internal counter one day closer to present

m=WiT                           //create loop internal counting variable
for j=1 to WiT                  //create loop to determine if BearTrend=true to set number of weeks
    if (wcp[m] > price)         //evaluate if BullTrend=false comparing the current price to a paticular week close
        BullTrend := false      //set value to false if older price value is greater than newer: trending down
        break                   //break out of for loop when trend first falters
    if (wcp[m] < price)         //evaluate if BullTrend=true comparing the current price to a paticular week close
        BullTrend := true       //set value to true if older price value is less than newer: trending up
    m:=m-1                      //set internal counter one day closer to present


//Determine if crossings occur
SH_LGcrossover = crossover(SH_SMA, LG_SMA)  //returns true if short crosses over long
SH_LGcrossunder = crossunder(SH_SMA, LG_SMA)    //returns true if short crosses under long

//Determine the slope of the SMAs when a cross over occurs
SlopeFactor= input(title="Slope Factor", defval=.01, minval=0, step = 0.001) //user input variable for what slope to evaluate against
XSlopeSH = abs(SH_SMA-SH_SMA[2]) //slope of short moving average (time cancels out)
XSlopeLG = abs(LG_SMA-LG_SMA[2]) //slope of long moving average (time cancels out)
StrongSlope = iff (abs(XSlopeSH-XSlopeLG)>SlopeFactor, true, false) //create a boolean variable to determine is slope intensity requirement is met

// ************************************ INPUT BACKTEST RANGE ******************************************=== coutesy of alanaster
fromMonth = input(defval = 4,    title = "From Month",      type = input.integer, minval = 1, maxval = 12)
fromDay   = input(defval = 1,    title = "From Day",        type = input.integer, minval = 1, maxval = 31)
fromYear  = input(defval = 2020, title = "From Year",       type = input.integer, minval = 1970)
thruMonth = input(defval = 1,    title = "Thru Month",      type = input.integer, minval = 1, maxval = 12)
thruDay   = input(defval = 1,    title = "Thru Day",        type = input.integer, minval = 1, maxval = 31)
thruYear  = input(defval = 2112, title = "Thru Year",       type = input.integer, minval = 1970)

// === INPUT SHOW PLOT ===
showDate  = input(defval = true, title = "Show Date Range", type = input.bool)

// === FUNCTION EXAMPLE ===
start     = timestamp(fromYear, fromMonth, fromDay, 00, 00)        // backtest start window
finish    = timestamp(thruYear, thruMonth, thruDay, 23, 59)        // backtest finish window
window()  => true

bgcolor(color = showDate and window() ? color.gray : na, transp = 90)
// === EXECUTION ===
//strategy.entry("L", strategy.long, when = window() and crossOv)    // enter long when "within window of time" AND crossover
//strategy.close("L", when = window() and crossUn)                   // exit long when "within window of time" AND crossunder

// 3. Output strategy data*************************************************************************************************************************************************************************

//Embolden line if a trend exists
trendcolorLG = BearTrend?color.red:color.black //highlights beartrend condition met graphically
trendcolorSH = BullTrend?color.green:color.black //highlights beartrend condition met graphically

//plot SMAs
plot(SH_SMA, title = "SH SMA", color = trendcolorSH)
plot(LG_SMA, title = "LG SMA", color = trendcolorLG)
plot(GV_SMA, title = "GV SMA", color = color.silver, linewidth = 4, transp = 70)

//Highlight crossovers
plotshape(series=SH_LGcrossover, style=shape.arrowup, location=location.belowbar,size=size.normal, color=color.green)
plotshape(series=SH_LGcrossunder, style=shape.arrowdown, location=location.abovebar,size=size.normal, color=color.red)

// 4. Determine Long & Short Entry Calculations*************************************************************************************************************************************************************************

//Define countback variable
countback=input(minval=0, maxval=5, title="Price CountBack", defval=0)
//User input for what evaluations to run: SMA or SMA + EMA
SMA_Y_N=input(defval = "Y", title="Run SMA", type=input.string, options=["Y", "N"])
MACD_Y_N=input(defval = "N", title="Run MACD", type=input.string, options=["Y", "N"])

//Calculate SMA Cross entry conditions
SMAbuy=false
SMAsell=false
SMAbuy := SH_LGcrossover and StrongSlope and BearTrend[WiT*7]   //enter long if short SMA crosses over long SMA & security has been in a BearTrend for 'n' days back
SMAsell := SH_LGcrossunder and StrongSlope and BullTrend[WiT*7] //enter short if short SMA crosses under long SMA & security has been in a BullTrend for 'n' days back

//Calculate MACD Cross entry conditions
MACDbuy = iff(MACD_Y_N=="Y", crossunder(signal[countback], macd[countback]), true) and iff(MACD_Y_N=="Y", macd[countback]<0, true) and StrongSlope and BearTrend     //enter long if fast MACD crosses over slow MACD & there is a strong slope & security has been in a BearTrend for 'n' days back
MACDsell = iff(MACD_Y_N=="Y", crossunder(macd[countback], signal[countback]), true) and iff(MACD_Y_N=="Y", signal[countback]>0, true) and StrongSlope and BullTrend  //enter short if fast MACD crosses under slow MACD & there is a strong slope & security has been in a BullTrend for 'n' days back

//long entry condition
dataHCLB=(iff(SMA_Y_N=="Y", SMAbuy, true) and iff(MACD_Y_N=="Y", MACDbuy, true))
plotshape(dataHCLB, title= "HC-LB", color=color.lime, style=shape.circle, text="HC-LB")
strategy.entry("HC-Long", strategy.long, comment="HC-Long", when = dataHCLB and window())

//short entry condition
dataHCSB=(iff(SMA_Y_N=="Y", SMAsell, true) and iff(MACD_Y_N=="Y", MACDsell, true))
plotshape(dataHCSB, title= "HC-SB", color=color.fuchsia, style=shape.circle, text="HC-SB")
strategy.entry("HC-Short", strategy.short, comment="HC-Short", when=dataHCSB and window())


// 5. Submit Profit and Loss Exit Calculations Orders*************************************************************************************************************************************************************************

// User Options to Change Inputs (%)
stopPer = input(12, title='Stop Loss %', type=input.float) / 100
takePer = input(25, title='Take Profit %', type=input.float) / 100

// Determine where you've entered and in what direction
longStop = strategy.position_avg_price * (1 - stopPer)
shortStop = strategy.position_avg_price * (1 + stopPer)
shortTake = strategy.position_avg_price * (1 - takePer)
longTake = strategy.position_avg_price * (1 + takePer)

//exit position conditions and orders
if strategy.position_size > 0//or crossunder(price[countback], upperBB)
    strategy.exit(id="Close Long", when = window(), stop=longStop, limit=longTake)
if strategy.position_size < 0 //or crossover(price[countback], lowerBB)
    strategy.exit(id="Close Short", when = window(), stop=shortStop, limit=shortTake)


//Evaluate/debug equation***************************************************************************************************************************************************************************
// plotshape((n==5? true : na), title='n=5', style=shape.labeldown, location=location.abovebar, text='5', color=color.white, textcolor=color.black, transp=0) //print n value if 5
// plotshape((n==4? true : na), title='n=4', style=shape.labeldown, location=location.abovebar, text='4', color=color.white, textcolor=color.black, transp=0) //print n value if 4
// plotshape((n==3? true : na), title='n=3', style=shape.labeldown, location=location.abovebar, text='3', color=color.white, textcolor=color.black, transp=0) //print n value if 3
// plotshape((n==2? true : na), title='n=2', style=shape.labeldown, location=location.abovebar, text='2', color=color.white, textcolor=color.black, transp=0) //print n value if 2
// plotshape((n==1? true : na), title='n=1', style=shape.labeldown, location=location.abovebar, text='1', color=color.white, textcolor=color.black, transp=0) //print n value if 1
// lineValue = 11                                           //set random visible line value to check when equation is true
// colorP = (BearTrend==true) ? color.green : color.red
// plot (lineValue, title = "BearTrend", color = colorP)   //Plot when condition true=green, false=red
// plot (XSlopeLG+15, color=color.white) //used for code debugging
// plot (XSlopeSH+15, color=color.blue) //used for code debugging
// plot (abs(XSlopeSH-XSlopeLG)+20, color=color.fuchsia) //used for code debugging