Strategi Trailing Stop Loss Saluran Harga Dinamis
Ringkasan
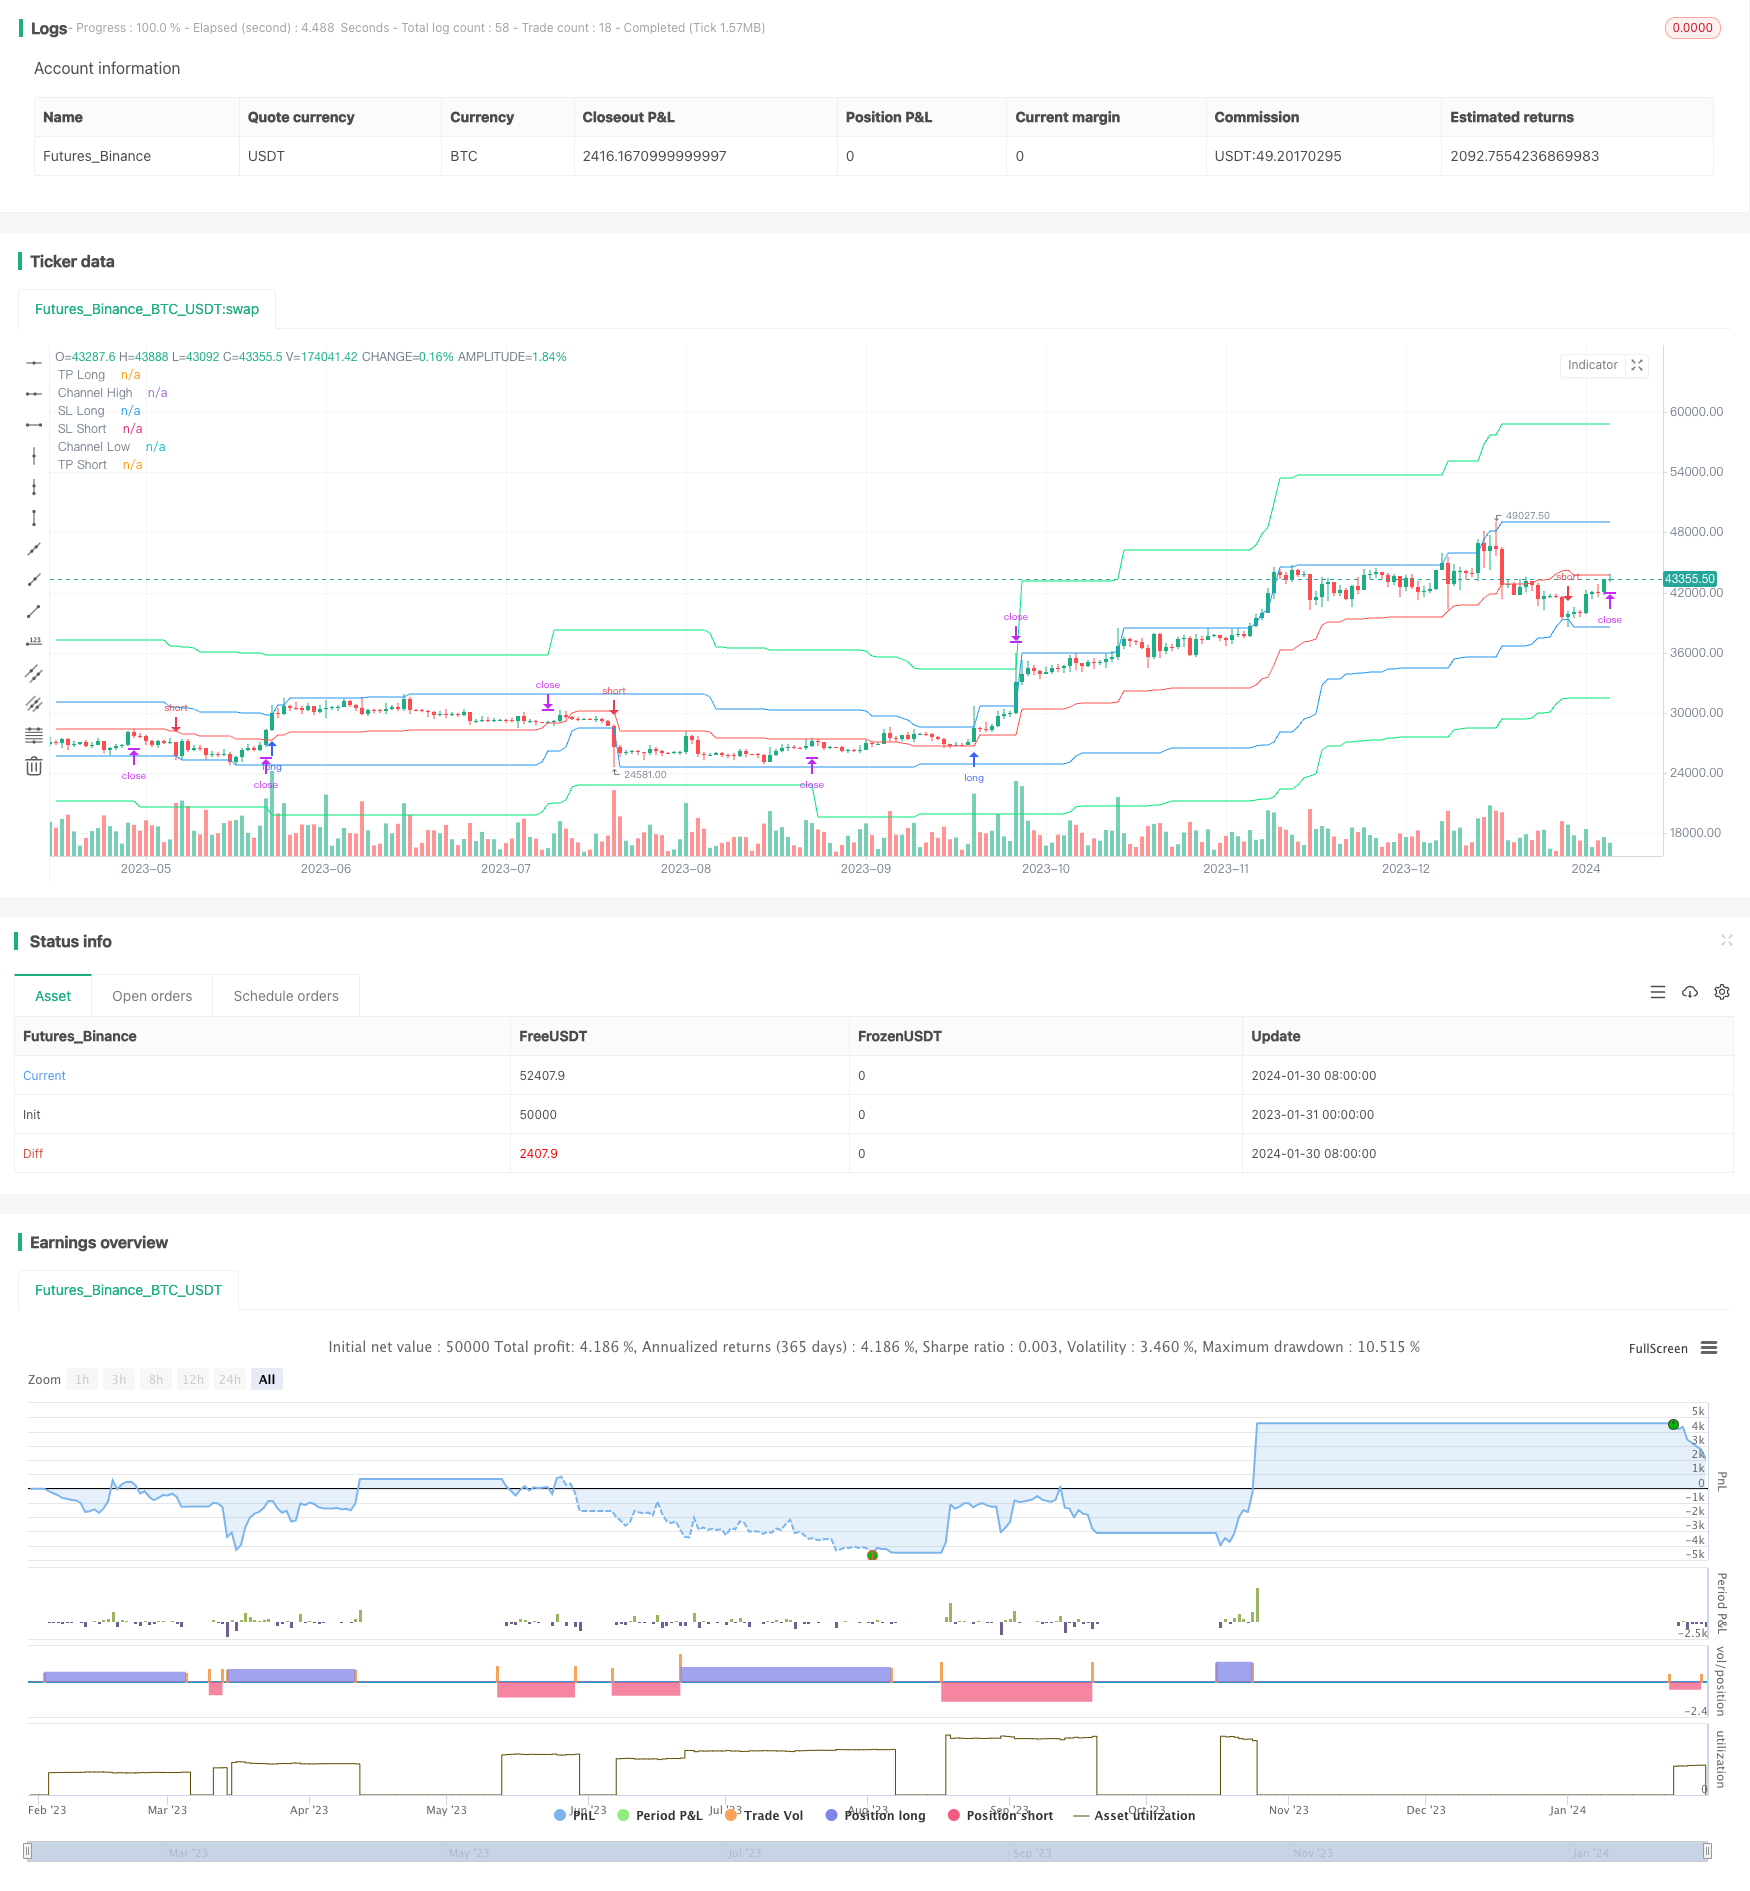
Strategi ini dikembangkan berdasarkan indikator saluran harga Donchian. Indikator ini membentuk saluran harga dengan menghitung harga tertinggi dan terendah dalam periode tertentu. Strategi ini memanfaatkan saluran harga untuk melakukan perdagangan dua arah dan menetapkan harga stop loss dan stop loss.
Prinsip Strategi
Pertama, strategi menghitung batas atas h dan batas bawah l dari saluran harga berdasarkan parameter pclen. Pusat garis tengah adalah rata-rata batas atas dan bawah saluran harga. Kemudian, berdasarkan parameter stop stop untuk posisi panjang dan kosong, tp, menghitung harga stop tpl dan tps.
Logika transaksi adalah sebagai berikut:
Sinyal untuk membuka posisi lebih banyak: harga lebih besar dari batas atas saluran h dan membuka posisi lebih banyak ketika kembali ke dalam saluran Sinyal posisi terendah: harga terendah di bawah garis tengah saluran (stop loss) atau lebih tinggi dari harga terendah (stop loss)
Tanda kosong: harga lebih rendah dari batas bawah saluran l dan kembali ke dalam saluran saat kosong Sinyal posisi kosong: saat harga lebih tinggi dari channel center line (stop loss) atau lebih rendah dari stop loss price (tps (stop loss))
Analisis Keunggulan
Strategi ini memiliki keuntungan sebagai berikut:
- Perdagangan dua arah, untuk menangkap perubahan tren harga
- Menggunakan Saluran Harga untuk Mengidentifikasi Trend dan Menghindari False Breakthroughs
- Tetapkan Stop Loss, Kendalikan Risiko
- Perhitungan ukuran posisi terkait dengan ukuran risiko, untuk mencapai risiko terkendali
- Pelacakan Stop Loss dan Stop Loss untuk Mengunci Lebih Banyak Keuntungan
Analisis risiko
Strategi ini juga memiliki beberapa risiko:
- Setting parameter saluran harga yang tidak tepat dapat menyebabkan frekuensi perdagangan yang terlalu tinggi atau kehilangan peluang perdagangan
- Harga Stop Loss yang terlalu toleran dapat meningkatkan celah risiko
- Tracking Stop dapat dipicu lebih awal pada periode fluktuasi tinggi
Risiko ini dapat dikurangi dan dikontrol dengan penyesuaian parameter dan pemantauan manual.
Arah optimasi
Strategi ini juga dapat dioptimalkan dalam beberapa hal:
- Menambahkan lebih banyak indikator untuk menilai filter dan menghindari sering melakukan posisi kosong dalam situasi yang tidak stabil.
- Anda dapat menguji algoritma stop loss yang berbeda, seperti stop loss ATR.
- Perluas sistem perdagangan lintas periode waktu untuk menentukan arah tren menggunakan periode waktu yang lebih tinggi
- Menambahkan modul manajemen posisi, menyesuaikan posisi sesuai dengan proporsi penggunaan dana
- Menggunakan model pembelajaran mesin untuk menilai tingkat keberhasilan harga terobosan dan menghindari terobosan palsu
Meringkaskan
Strategi ini secara keseluruhan adalah metode yang efektif untuk melakukan perdagangan dua arah menggunakan indikator saluran harga. Dengan pengaturan stop loss dan modul kontrol posisi, risiko dapat dikontrol dengan baik. Dengan optimasi dan penyesuaian tertentu, dapat menjadi strategi perdagangan kuantitatif yang kuat.
/*backtest
start: 2023-01-31 00:00:00
end: 2024-01-31 00:00:00
period: 1d
basePeriod: 1h
exchanges: [{"eid":"Futures_Binance","currency":"BTC_USDT"}]
*/

//Noro
//2020

//@version=4
strategy(title = "Noro's RiskDonchian Strategy", shorttitle = "RiskDonchian str", overlay = true, default_qty_type = strategy.percent_of_equity, initial_capital = 100, default_qty_value = 100, commission_value = 0.1)

//Settings
needlong = input(true, defval = true, title = "Long")
needshort = input(true, defval = true, title = "Short")
tp = input(defval = 20.0, minval = 1, title = "Take-profit, %")
tptype = input(defval = "2. Fix", options = ["1. None", "2. Fix", "3. Trailing"], title = "Take-profit type")
sltype = input(defval = "2. Center", options = ["1. None", "2. Center"], title = "Take-profit type")
risklong  = input(5.0, minval = 0.0, maxval = 99.9, title = "Risk size for long, %")
riskshort = input(5.0, minval = 0.0, maxval = 99.9, title = "Risk size for short, %")
pclen = input(50, minval = 1, title = "Price Channel Length")
showll = input(true, defval = true, title = "Show lines")
showbg = input(false, defval = false, title = "Show Background")
showof = input(true, defval = true, title = "Show Offset")
showlabel = input(true, defval = true, title = "Show label")
fromyear = input(1900, defval = 1900, minval = 1900, maxval = 2100, title = "From Year")
toyear = input(2100, defval = 2100, minval = 1900, maxval = 2100, title = "To Year")
frommonth = input(01, defval = 01, minval = 01, maxval = 12, title = "From Month")
tomonth = input(12, defval = 12, minval = 01, maxval = 12, title = "To Month")
fromday = input(01, defval = 01, minval = 01, maxval = 31, title = "From day")
today = input(31, defval = 31, minval = 01, maxval = 31, title = "To day")

//Price Channel
h = highest(high, pclen)
l = lowest(low, pclen)
center = (h + l) / 2

//Take-profit
tpl = 0.0
tpl := tptype == "2. Fix" and strategy.position_size > 0 ? tpl[1] : h * (100 + tp) / 100

//Stop-loss
tps = 0.0
tps := tptype == "2. Fix" and strategy.position_size < 0 ? tps[1] : l * (100 - tp) / 100

//Lines
tplcol = showll and needlong and tptype != "1. None" ? color.lime : na
pclcol = showll and needlong ? color.blue : na
sllcol = showll and needlong and sltype != "1. None" ? color.red : na
tpscol = showll and needshort and tptype != "1. None" ? color.lime : na
pcscol = showll and needshort ? color.blue : na
slscol = showll and needshort and sltype != "1. None" ? color.red : na
offset = showof ? 1 : 0
plot(tpl, offset = offset, color = tplcol, title = "TP Long")
plot(h, offset = offset, color = pclcol, title = "Channel High")
plot(center, offset = offset, color = sllcol, title = "SL Long")
plot(center, offset = offset, color = slscol, title = "SL Short")
plot(l, offset = offset, color = pcscol, title = "Channel Low")
plot(tps, offset = offset, color = tpscol, title = "TP Short")

//Background
size = strategy.position_size
bgcol = showbg == false ? na : size > 0 ? color.lime : size < 0 ? color.red : na
bgcolor(bgcol, transp = 70)

//Lot size
risksizelong = -1 * risklong
risklonga = ((center / h) - 1) * 100
coeflong = abs(risksizelong / risklonga)
lotlong = (strategy.equity / close) * coeflong
risksizeshort = -1 * riskshort
riskshorta = ((center / l) - 1) * 100
coefshort = abs(risksizeshort / riskshorta)
lotshort = (strategy.equity / close) * coefshort

//Trading
truetime = time > timestamp(fromyear, frommonth, fromday, 00, 00) and time < timestamp(toyear, tomonth, today, 23, 59)
mo = 0
mo := strategy.position_size != 0 ? 0 : high >= center[1] and low <= center[1] ? 1 : mo[1]

if h > 0
    longlimit = tptype == "1. None" ? na : tpl
    longstop = sltype == "1. None" ? na : center
    strategy.entry("Long", strategy.long, lotlong, stop = h, when = strategy.position_size <= 0 and needlong and truetime and mo)
    strategy.exit("TP Long", "Long", limit = longlimit, stop = longstop)
    shortlimit = tptype == "1. None" ? na : tps
    shortstop = sltype == "1. None" ? na : center
    strategy.entry("Short", strategy.short, lotshort, stop = l, when = strategy.position_size >= 0 and needshort and truetime and mo)
    strategy.exit("Exit Short", "Short", limit = shortlimit, stop = shortstop)
if time > timestamp(toyear, tomonth, today, 23, 59)
    strategy.close_all()
    strategy.cancel("Long")
    strategy.cancel("Short")

if showlabel

    //Drawdown
    max = 0.0
    max := max(strategy.equity, nz(max[1]))
    dd = (strategy.equity / max - 1) * 100
    min = 100.0
    min := min(dd, nz(min[1]))

    //Label
    min := round(min * 100) / 100
    labeltext = "Drawdown: " + tostring(min) + "%"
    var label la = na
    label.delete(la)
    tc = min > -100 ? color.white : color.red
    osx = timenow + round(change(time)*10)
    osy = highest(100)