Strategi konvergensi arah momentum perdagangan kuantitatif
Ringkasan
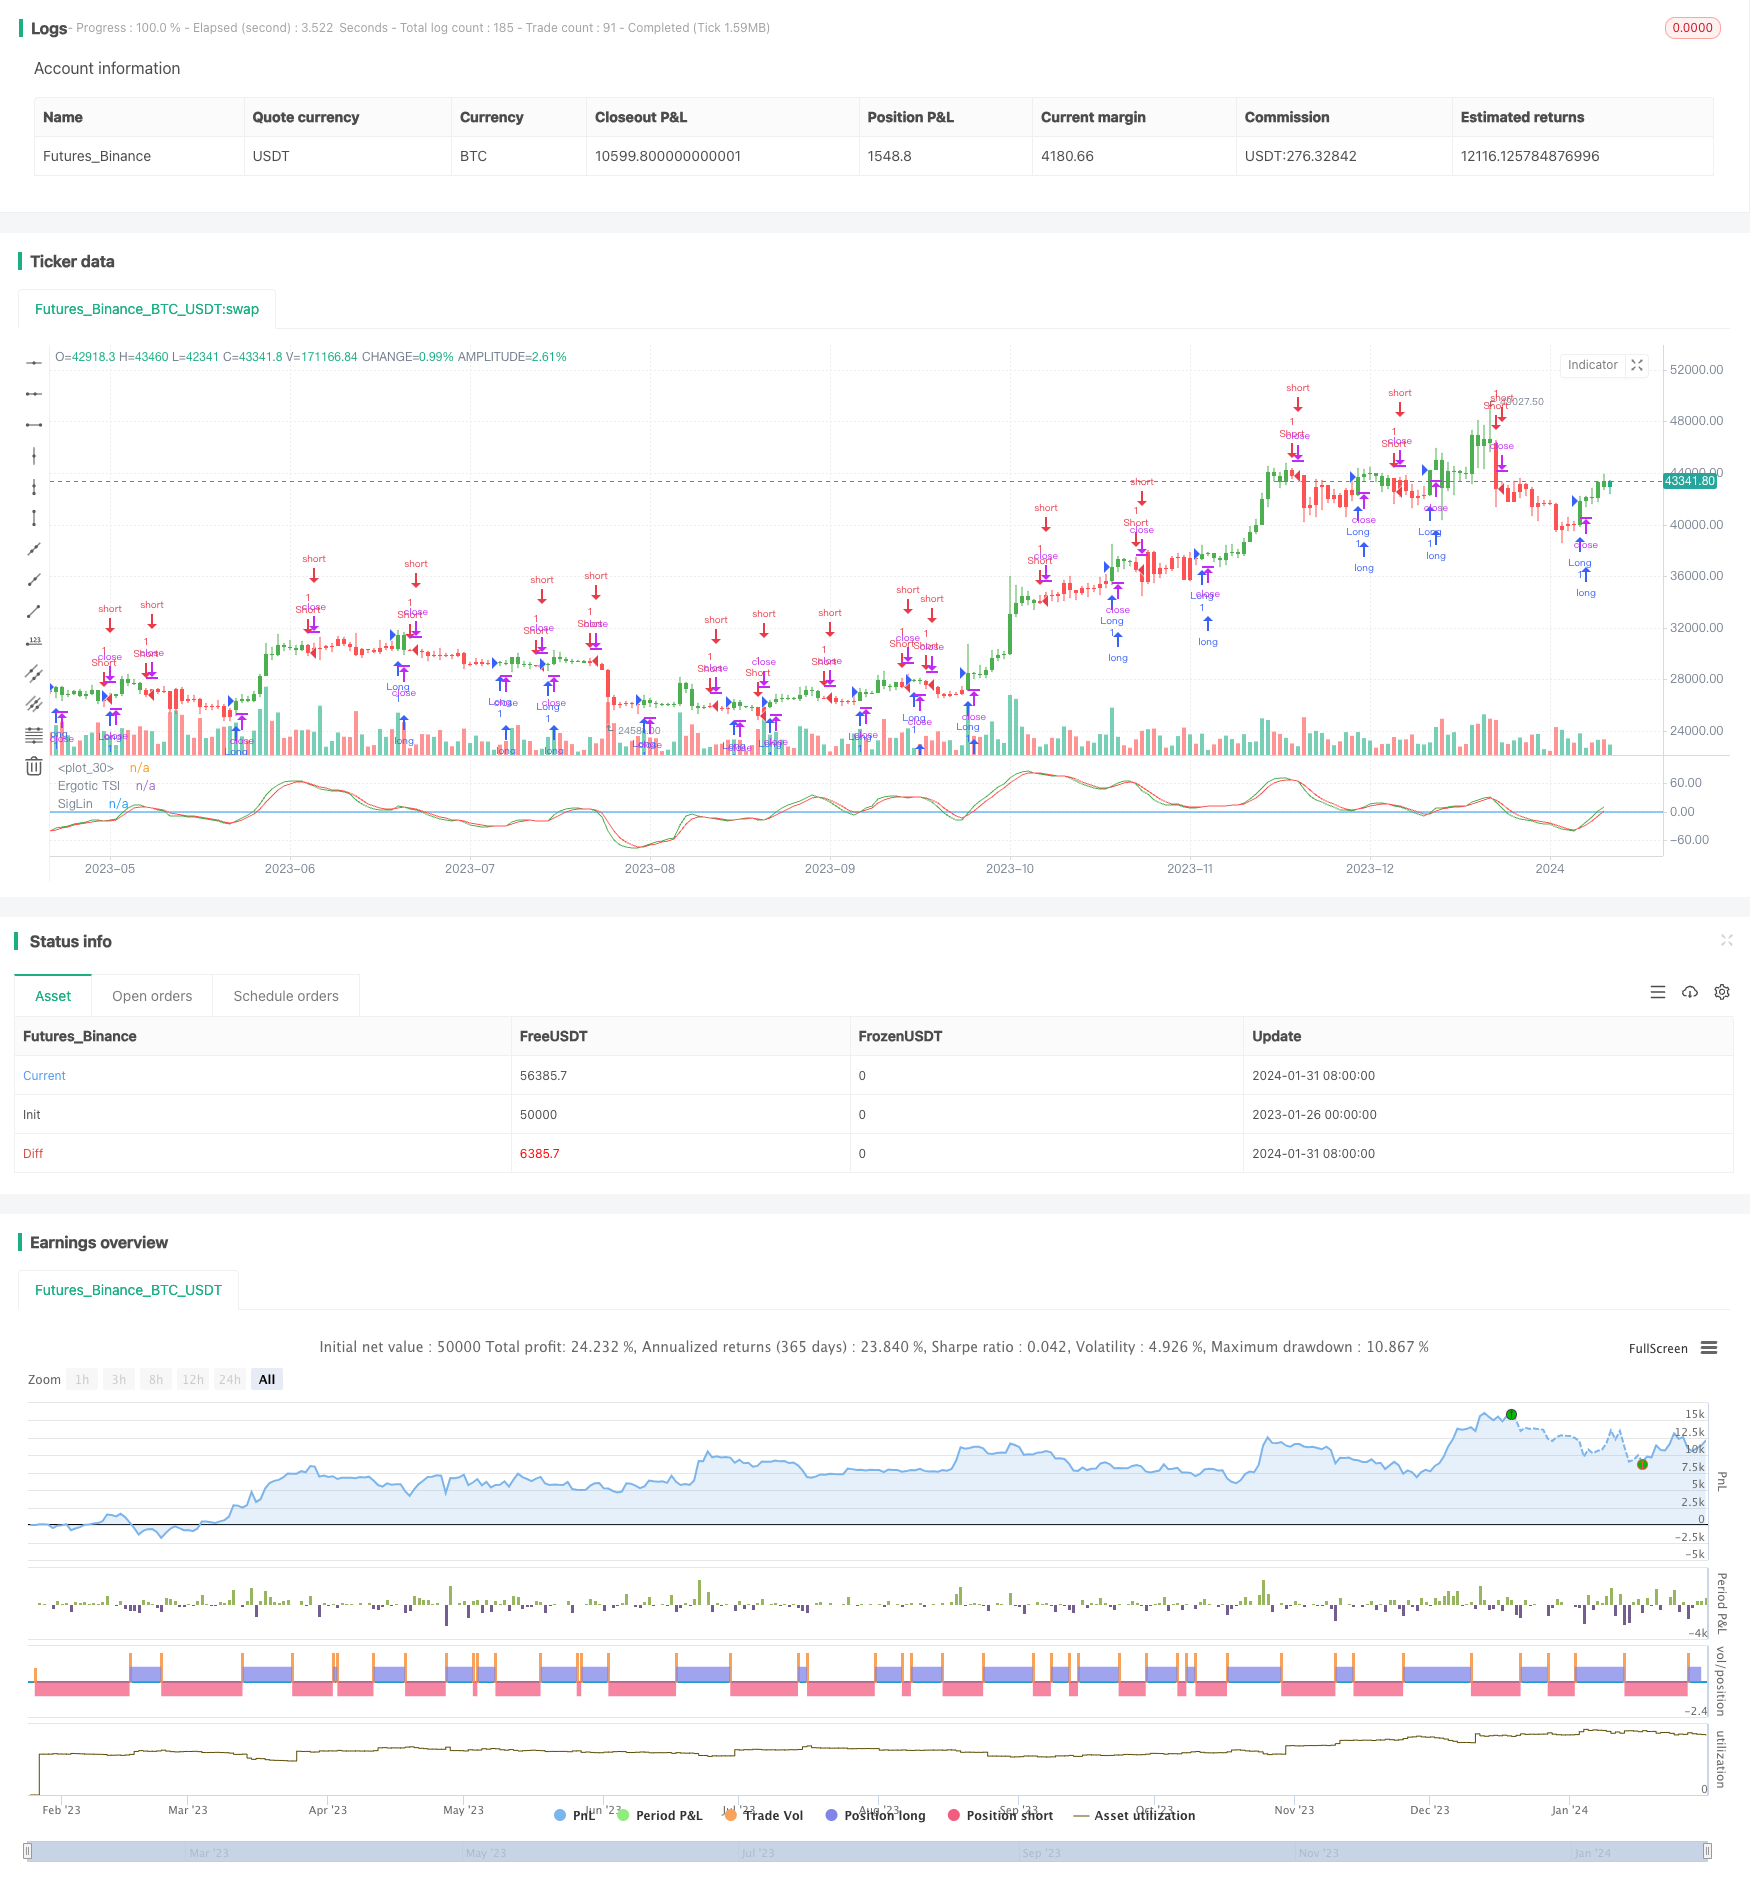
Strategi ini bernama Quantitative Trading Momentum Direction Convergence Strategy Curve, adalah strategi perdagangan kuantitatif yang dirancang berdasarkan indikator teknis yang dijelaskan oleh William Blau dalam bukunya Momentum, Direction and Divergence. Strategi ini berfokus pada tiga dimensi kunci, yaitu momentum, arah, dan konvergensi, untuk menilai arah tren pasar dengan menghitung indikator momentum harga saham, dan mencari perbedaan antara harga dan indikator untuk mendapatkan peluang perdagangan.
Prinsip Strategi
Indikator inti dari strategi ini adalah Indeks Kinerja Darurat (Ergotic TSI), yang dihitung dengan rumus sebagai berikut:
Val1 = 100 * EMA(EMA(EMA(价格变化量,r),s),u)

Val2 = EMA(EMA(EMA(价格变化量的绝对值,r),s),u)

Ergotic TSI = 如果Val2不等于0,则为Val1/Val2,否则为0
Di antaranya, r, s, u adalah parameter smoothing. Indikator ini mencerminkan proporsi perubahan harga terhadap nilai mutlak perubahan harga, yang merupakan indikator getaran dinamis. Kemudian kita menghitung rata-rata bergerak smoothing EMA dari Ergotic TSI sebagai garis sinyal.
Analisis Keunggulan
Strategi ini memiliki beberapa keuntungan:
- Kemampuan untuk menangkap tren perubahan harga
- Ini adalah filter yang bagus untuk pergerakan harga.
- Memiliki ciri-ciri yang lebih baik
- Fleksibel dalam pengaturan parameter, dapat disesuaikan dengan kelancaran
Analisis risiko
Strategi ini juga memiliki beberapa risiko:
- Pada saat itu, sinyal yang salah akan muncul.
- Setting parameter yang salah akan kehilangan peluang perdagangan atau menambah sinyal palsu
- Parameter perlu disesuaikan dengan varietas dan lingkungan perdagangan yang berbeda
Pengendalian risiko dapat dilakukan dengan mengoptimalkan parameter, mengkombinasikan indikator lainnya, dan mengatur stop loss.
Arah optimasi
Strategi ini dapat dioptimalkan dalam beberapa hal:
- Uji input harga yang berbeda seperti harga buka, harga tutup, dan harga tengah.
- Menyesuaikan nilai-nilai parameter r, s, u untuk mencari kombinasi parameter yang optimal
- Menambahkan indikator lain atau kondisi penyaringan untuk mengkonfirmasi sinyal lebih lanjut
- Menetapkan Stop Loss dan Mekanisme Keluar
Meringkaskan
Strategi ini secara menyeluruh mempertimbangkan perubahan momentum, penilaian tren dan karakteristik yang menyimpang, yang dapat secara efektif menangkap peluang tren. Dengan cara pengoptimalan parameter, penyaringan sinyal dan pengendalian risiko, kinerja strategi yang lebih baik dapat diperoleh. Secara keseluruhan, strategi ini dirancang dengan cukup masuk akal dan layak untuk penelitian dan praktik lebih lanjut.
/*backtest
start: 2023-01-26 00:00:00
end: 2024-02-01 00:00:00
period: 1d
basePeriod: 1h
exchanges: [{"eid":"Futures_Binance","currency":"BTC_USDT"}]
*/

//@version = 2
////////////////////////////////////////////////////////////
//  Copyright by HPotter v1.0 13/12/2016
// r - Length of first EMA smoothing of 1 day momentum        4
// s - Length of second EMA smoothing of 1 day smoothing      8
// u- Length of third EMA smoothing of 1 day momentum         6
// Length of EMA signal line                                  3
// Source of Ergotic TSI                                      Close
//
// This is one of the techniques described by William Blau in his book "Momentum,
// Direction and Divergence" (1995). If you like to learn more, we advise you to
// read this book. His book focuses on three key aspects of trading: momentum,
// direction and divergence. Blau, who was an electrical engineer before becoming
// a trader, thoroughly examines the relationship between price and momentum in
// step-by-step examples. From this grounding, he then looks at the deficiencies
// in other oscillators and introduces some innovative techniques, including a
// fresh twist on Stochastics. On directional issues, he analyzes the intricacies
// of ADX and offers a unique approach to help define trending and non-trending periods.
//
// You can use in the xPrice any series: Open, High, Low, Close, HL2, HLC3, OHLC4 and ect...
// You can change long to short in the Input Settings
// Please, use it only for learning or paper trading. Do not for real trading.
////////////////////////////////////////////////////////////
strategy(title="Ergotic TSI Strategy Backtest")
r = input(4, minval=1)
s = input(8, minval=1)
u = input(6, minval=1)
SmthLen = input(3, minval=1)
reverse = input(false, title="Trade reverse")
hline(0, color=blue, linestyle=line)
xPrice = close
xPrice1 = xPrice - xPrice[1]
xPrice2 = abs(xPrice - xPrice[1])
xSMA_R = ema(ema(ema(xPrice1,r), s),u)
xSMA_aR = ema(ema(ema(xPrice2, r), s),u)
Val1 = 100 * xSMA_R
Val2 = xSMA_aR
xTSI = iff (Val2 != 0, Val1 / Val2, 0)
xEMA_TSI = ema(xTSI, SmthLen)
pos = iff(xTSI > xEMA_TSI, 1,
	   iff(xTSI < xEMA_TSI, -1, nz(pos[1], 0)))
possig = iff(reverse and pos == 1, -1,
          iff(reverse and pos == -1, 1, pos))
if (possig == 1)
    strategy.entry("Long", strategy.long)
if (possig == -1)
    strategy.entry("Short", strategy.short)
barcolor(possig == -1 ? red: possig == 1 ? green : blue )
plot(xTSI, color=green, title="Ergotic TSI")
plot(xEMA_TSI, color=red, title="SigLin")