Strategi Mengikuti Tren Filter Rentang Ganda
Ringkasan
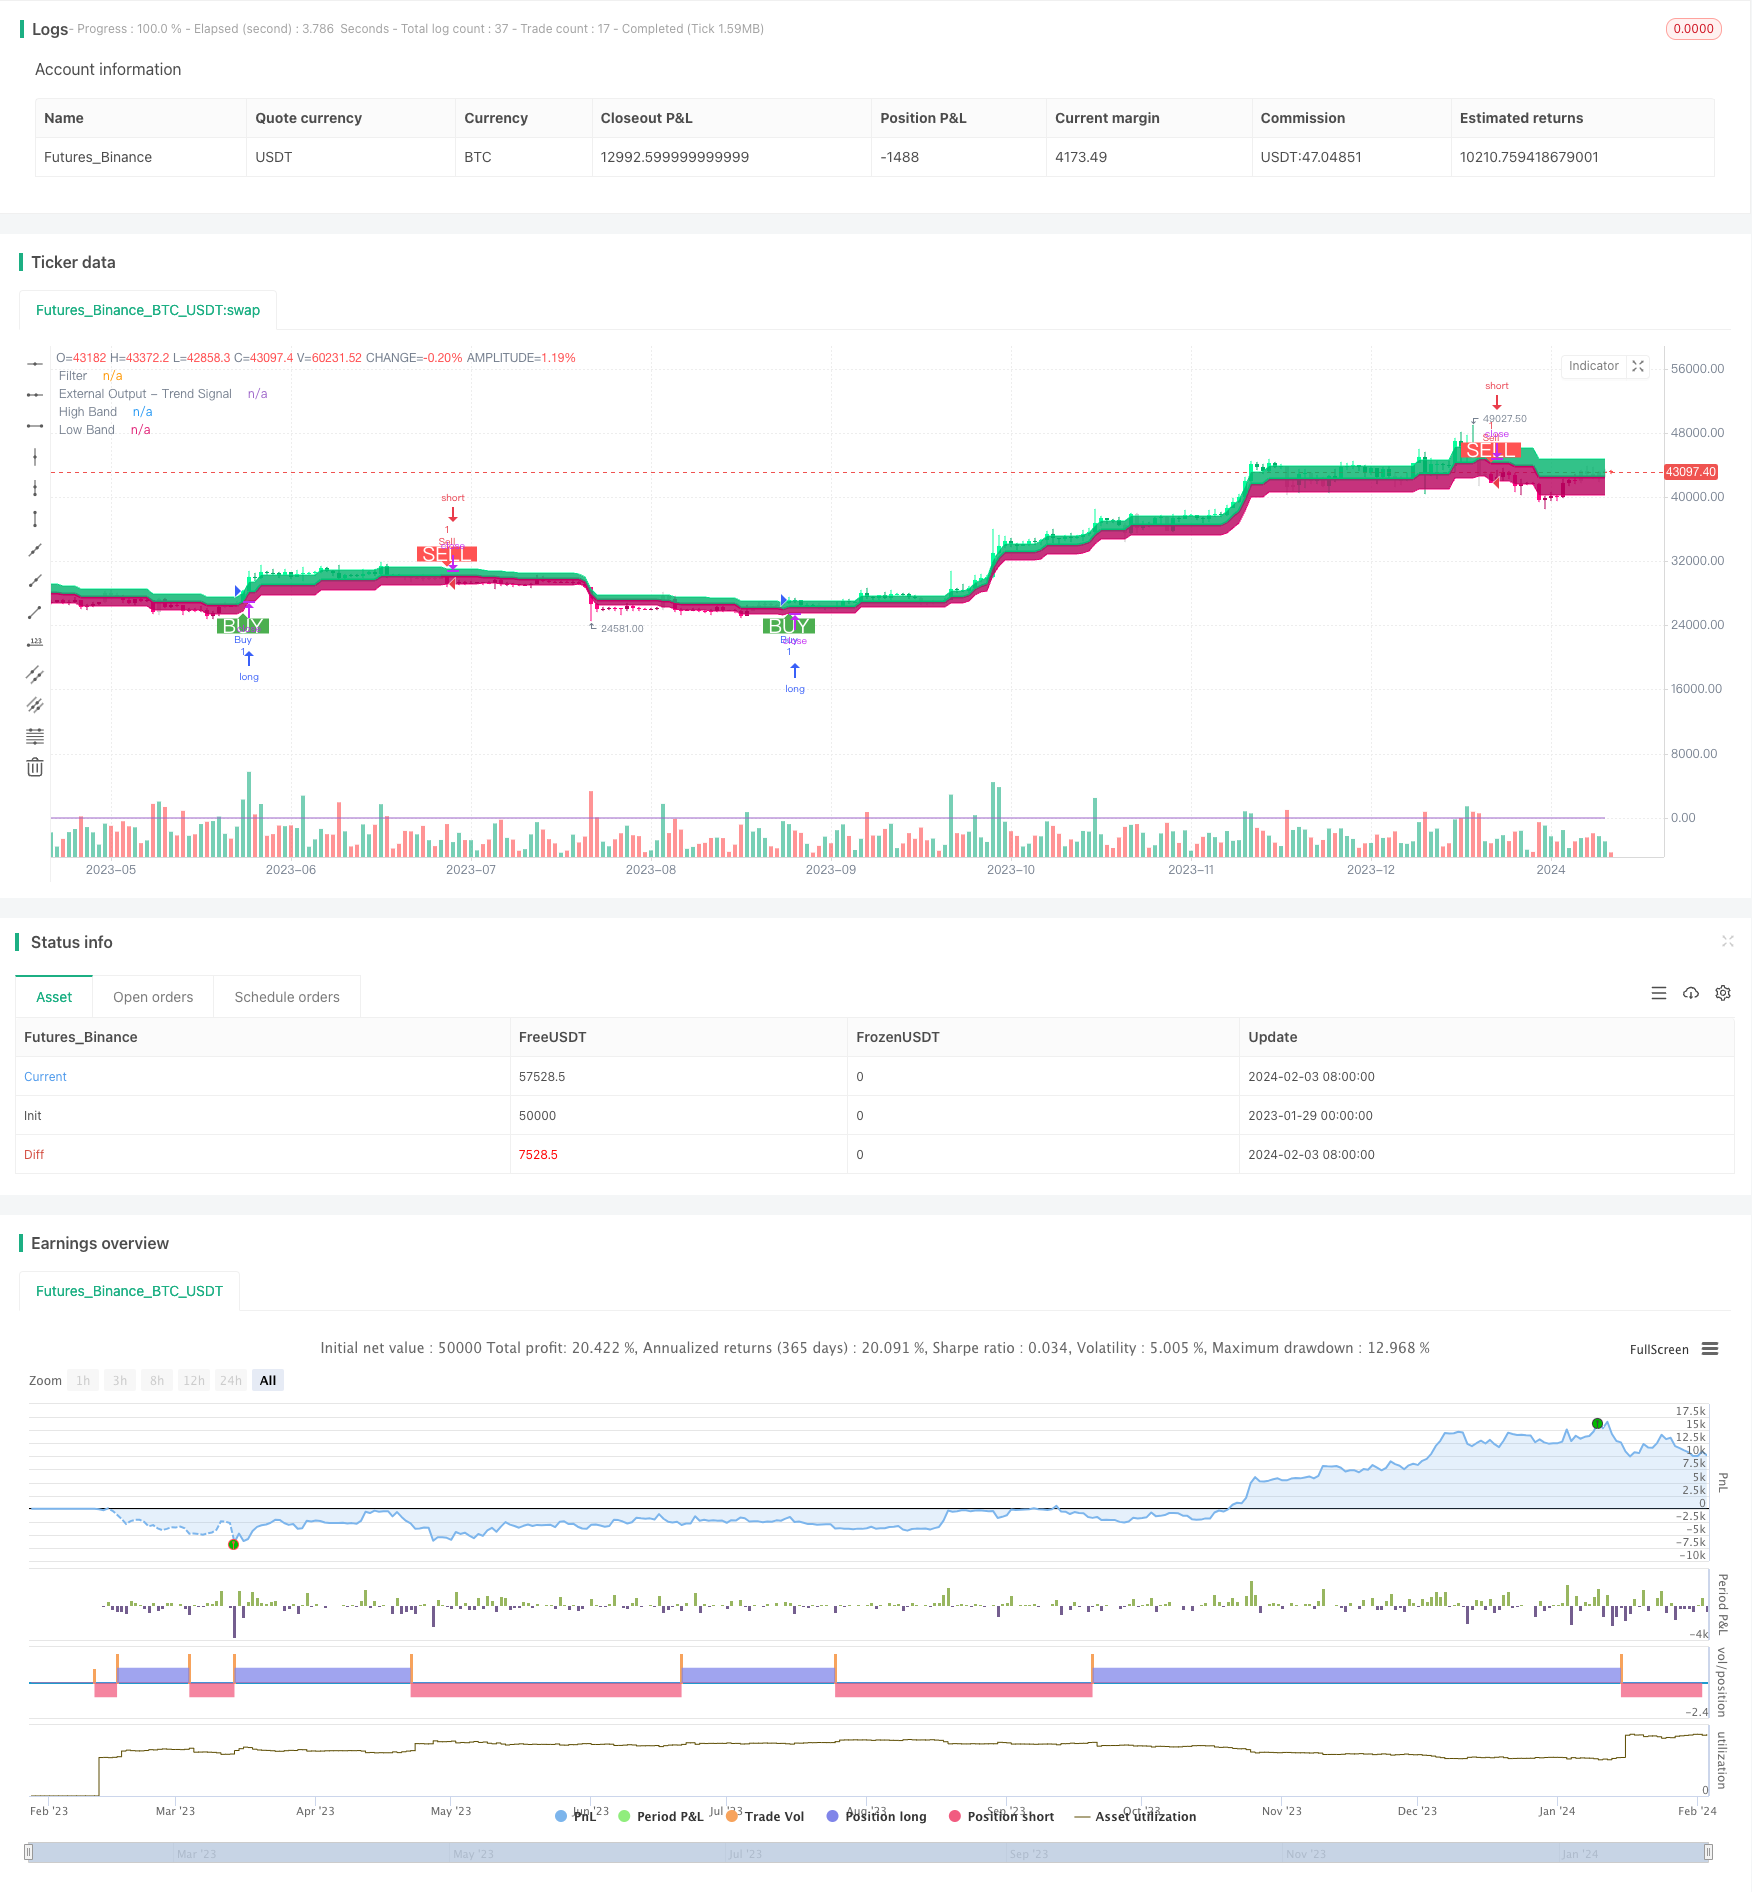
Dual Range Filter Trend Tracking Strategy adalah strategi perdagangan kuantitatif yang menggunakan dua filter jangkauan EMA untuk mengidentifikasi arah tren dan melacak tren. Strategi ini menggabungkan dua filter garis rata dan perhitungan jangkauan ATR untuk mengidentifikasi arah tren garis tengah dan panjang secara efektif dan menggunakan stop loss untuk mengunci keuntungan.
Prinsip Strategi
Inti dari strategi ini adalah filter rentang dua EMA. Ini menghitung rentang ATR dari garis K dan meluruskannya, kemudian menggabungkan dua EMA untuk menentukan lokasi garis K dalam rentang untuk menentukan apakah saat ini sedang dalam tren.
Secara khusus, strategi pertama-tama menghitung ukuran kisaran ATR dari garis K, kemudian menggabungkan dua EMA untuk meluruskannya. Kisaran ATR mewakili kisaran fluktuasi normal garis K. Ketika harga melampaui kisaran ini, itu berarti ada perubahan tren. Strategi mencatat arah harga menembus kisaran EMA.
Setelah masuk, strategi ini menggunakan stop loss floating untuk mengunci keuntungan. Selama memegang posisi, strategi ini akan menilai secara real-time apakah K-line kembali ke luar batas, dan jika terjadi, maka akan keluar dari posisi saat ini. Ini dapat secara efektif mengunci keuntungan dari perdagangan tren.
Analisis Keunggulan
Strategi pelacakan tren dengan filter dual-range menggabungkan keunggulan filter rata-rata dan perhitungan jangkauan untuk menentukan arah tren dengan akurat dan menghindari sering masuk dan keluar di pasar yang bergolak. Keuntungan spesifiknya adalah sebagai berikut:
- Menggunakan prinsip ATR untuk menentukan kisaran fluktuasi K-line, menghindari masuk ke dalam pasar yang tidak berorientasi saat bergoyang
- Filter EMA ganda meningkatkan akurasi penilaian dan mengurangi sinyal palsu
- Stop loss floating real-time yang efektif untuk mengunci keuntungan tren
- Strategi logis sederhana dan jelas, mudah dipahami dan dioptimalkan
Analisis risiko
Strategi ini juga memiliki beberapa risiko, yang terkonsentrasi pada beberapa hal:
- Kemacetan besar dapat menembus batas ATR, menyebabkan masuk lebih awal
- Dalam situasi tren yang kuat, stop loss dapat dipicu terlalu dini.
- Tidak tepatnya pengaturan parameter juga dapat mempengaruhi kinerja kebijakan
Risiko ini dapat diatasi dengan cara mengoptimalkan parameter yang tepat, mencegah false breakout, dan menilai kekuatan tren.
Saran untuk Optimasi
Strategi pelacakan tren dengan penyaringan dua kisaran memiliki potensi untuk dioptimalkan lebih lanjut, dengan beberapa optimalisasi utama:
- Optimalkan parameter ATR, smooth out K-line range
- Menghindari False Breakthroughs dengan Menggunakan Volume Trading
- Untuk menilai intensitas tren, bedakan antara terobosan tunggal dan tren berkelanjutan.
- Mengoptimalkan Stop Loss, Mengikuti Tren Meningkat Dengan Jaminan Keuntungan
Dengan optimasi ini, strategi dapat memperoleh keuntungan yang stabil di lingkungan pasar yang lebih luas.
Meringkaskan
Strategi pelacakan tren penyaringan dua kisaran menggabungkan beberapa keunggulan penyaringan rata-rata dan penilaian kisaran ATR, yang dapat secara efektif mengidentifikasi arah dan waktu masuk tren berkelanjutan garis tengah. Ini hanya masuk ke dalam permainan ketika tren berubah, dan menggunakan stop loss yang mengambang untuk mengunci keuntungan.
/*backtest
start: 2023-01-29 00:00:00
end: 2024-02-04 00:00:00
period: 1d
basePeriod: 1h
exchanges: [{"eid":"Futures_Binance","currency":"BTC_USDT"}]
*/

//@version=4
strategy("Range Filter [DW] & Labels", shorttitle="RF [DW] & Labels", overlay=true)

//Conditional Sampling EMA Function
Cond_EMA(x, cond, n)=>
    var val     = array.new_float(0)
    var ema_val = array.new_float(1)
    if cond
        array.push(val, x)
        if array.size(val) > 1
            array.remove(val, 0)
        if na(array.get(ema_val, 0))
            array.fill(ema_val, array.get(val, 0))
        array.set(ema_val, 0, (array.get(val, 0) - array.get(ema_val, 0))*(2/(n + 1)) + array.get(ema_val, 0))
    EMA = array.get(ema_val, 0)
    EMA

//Conditional Sampling SMA Function
Cond_SMA(x, cond, n)=>
    var vals = array.new_float(0)
    if cond
        array.push(vals, x)
        if array.size(vals) > n
            array.remove(vals, 0)
    SMA = array.avg(vals)
    SMA

//Standard Deviation Function
Stdev(x, n)=>
    sqrt(Cond_SMA(pow(x, 2), 1, n) - pow(Cond_SMA(x, 1, n), 2))

//Range Size Function
rng_size(x, scale, qty, n)=>
    ATR      = Cond_EMA(tr(true), 1, n)
    AC       = Cond_EMA(abs(x - x[1]), 1, n)
    SD       = Stdev(x, n)
    rng_size = scale=="Pips" ? qty*0.0001 : scale=="Points" ? qty*syminfo.pointvalue : scale=="% of Price" ? close*qty/100 : scale=="ATR" ? qty*ATR :
               scale=="Average Change" ? qty*AC : scale=="Standard Deviation" ? qty*SD : scale=="Ticks" ? qty*syminfo.mintick : qty

//Two Type Range Filter Function
rng_filt(h, l, rng_, n, type, smooth, sn, av_rf, av_n)=>
    rng_smooth = Cond_EMA(rng_, 1, sn)
    r          = smooth ? rng_smooth : rng_
    var rfilt  = array.new_float(2, (h + l)/2)
    array.set(rfilt, 1, array.get(rfilt, 0))
    if type=="Type 1"
        if h - r > array.get(rfilt, 1)
            array.set(rfilt, 0, h - r)
        if l + r < array.get(rfilt, 1)
            array.set(rfilt, 0, l + r)
    if type=="Type 2"
        if h >= array.get(rfilt, 1) + r
            array.set(rfilt, 0, array.get(rfilt, 1) + floor(abs(h - array.get(rfilt, 1))/r)*r)
        if l <= array.get(rfilt, 1) - r
            array.set(rfilt, 0, array.get(rfilt, 1) - floor(abs(l - array.get(rfilt, 1))/r)*r)
    rng_filt1 = array.get(rfilt, 0)
    hi_band1  = rng_filt1 + r
    lo_band1  = rng_filt1 - r
    rng_filt2 = Cond_EMA(rng_filt1, rng_filt1 != rng_filt1[1], av_n)
    hi_band2  = Cond_EMA(hi_band1, rng_filt1 != rng_filt1[1], av_n)
    lo_band2  = Cond_EMA(lo_band1, rng_filt1 != rng_filt1[1], av_n)
    rng_filt  = av_rf ? rng_filt2 : rng_filt1
    hi_band   = av_rf ? hi_band2 : hi_band1
    lo_band   = av_rf ? lo_band2 : lo_band1
    [hi_band, lo_band, rng_filt]

//-----------------------------------------------------------------------------------------------------------------------------------------------------------------
//Inputs
//-----------------------------------------------------------------------------------------------------------------------------------------------------------------

//Filter Type
f_type = input(defval="Type 1", options=["Type 1", "Type 2"], title="Filter Type")

//Movement Source
mov_src = input(defval="Close", options=["Wicks", "Close"], title="Movement Source")

//Range Size Inputs
rng_qty   = input(defval=2.618, minval=0.0000001, title="Range Size")
rng_scale = input(defval="Average Change", options=["Points", "Pips", "Ticks", "% of Price", "ATR", "Average Change", "Standard Deviation", "Absolute"], title="Range Scale")

//Range Period
rng_per = input(defval=14, minval=1, title="Range Period (for ATR, Average Change, and Standard Deviation)")

//Range Smoothing Inputs
smooth_range = input(defval=true, title="Smooth Range")
smooth_per   = input(defval=27, minval=1, title="Smoothing Period")

//Filter Value Averaging Inputs
av_vals    = input(defval=true, title="Average Filter Changes")
av_samples = input(defval=2, minval=1, title="Number Of Changes To Average")

// New inputs for take profit and stop loss
take_profit_percent = input(defval=100.0, minval=0.1, maxval=1000.0, title="Take Profit Percentage", step=0.1)
stop_loss_percent = input(defval=100, minval=0.1, maxval=1000.0, title="Stop Loss Percentage", step=0.1)

//-----------------------------------------------------------------------------------------------------------------------------------------------------------------
//Definitions
//-----------------------------------------------------------------------------------------------------------------------------------------------------------------

//High And Low Values
h_val = mov_src=="Wicks" ? high : close
l_val = mov_src=="Wicks" ? low : close

//Range Filter Values
[h_band, l_band, filt] = rng_filt(h_val, l_val, rng_size((h_val + l_val)/2, rng_scale, rng_qty, rng_per), rng_per, f_type, smooth_range, smooth_per, av_vals, av_samples)

//Direction Conditions
var fdir = 0.0
fdir    := filt > filt[1] ? 1 : filt < filt[1] ? -1 : fdir
upward   = fdir==1 ? 1 : 0
downward = fdir==-1 ? 1 : 0

//Colors
filt_color = upward ? #05ff9b : downward ? #ff0583 : #cccccc
bar_color  = upward and (close > filt) ? (close > close[1] ? #05ff9b : #00b36b) :
             downward and (close < filt) ? (close < close[1] ? #ff0583 : #b8005d) : #cccccc

//-----------------------------------------------------------------------------------------------------------------------------------------------------------------
//Outputs
//-----------------------------------------------------------------------------------------------------------------------------------------------------------------

//Filter Plot
filt_plot = plot(filt, color=filt_color, transp=0, linewidth=3,  title="Filter")

//Band Plots
h_band_plot = plot(h_band, color=#05ff9b, transp=100, title="High Band")
l_band_plot = plot(l_band, color=#ff0583, transp=100, title="Low Band")

//Band Fills
fill(h_band_plot, filt_plot, color=#00b36b, transp=85, title="High Band Fill")
fill(l_band_plot, filt_plot, color=#b8005d, transp=85, title="Low Band Fill")

//Bar Color
barcolor(bar_color)

//External Trend Output
plot(fdir, transp=100, editable=false, display=display.none, title="External Output - Trend Signal")

// Trading Conditions Logic
longCond = close > filt and close > close[1] and upward > 0 or close > filt and close < close[1] and upward > 0
shortCond = close < filt and close < close[1] and downward > 0 or close < filt and close > close[1] and downward > 0

CondIni = 0
CondIni := longCond ? 1 : shortCond ? -1 : CondIni[1]
longCondition = longCond and CondIni[1] == -1
shortCondition = shortCond and CondIni[1] == 1

// Strategy Entry and Exit
strategy.entry("Buy", strategy.long, when = longCondition)
strategy.entry("Sell", strategy.short, when = shortCondition)

// New: Close conditions based on percentage change
long_take_profit_condition = close > strategy.position_avg_price * (1 + take_profit_percent / 100)
short_take_profit_condition = close < strategy.position_avg_price * (1 - take_profit_percent / 100)

long_stop_loss_condition = close < strategy.position_avg_price * (1 - stop_loss_percent / 100)
short_stop_loss_condition = close > strategy.position_avg_price * (1 + stop_loss_percent / 100)

strategy.close("Buy", when = shortCondition or long_take_profit_condition or long_stop_loss_condition)
strategy.close("Sell", when = longCondition or short_take_profit_condition or short_stop_loss_condition)

// Plot Buy and Sell Labels
plotshape(longCondition, title = "Buy Signal", text ="BUY", textcolor = color.white, style=shape.labelup, size = size.normal, location=location.belowbar, color = color.green, transp = 0)
plotshape(shortCondition, title = "Sell Signal", text ="SELL", textcolor = color.white, style=shape.labeldown, size = size.normal, location=location.abovebar, color = color.red, transp = 0)

// Alerts
alertcondition(longCondition, title="Buy Alert", message = "BUY")
alertcondition(shortCondition, title="Sell Alert", message = "SELL")