Strategi kuantitatif berdasarkan pivot Kamachira dan Bollinger band

1
Follow
1782
Followers
Ringkasan
Strategi ini pertama-tama menghitung titik pivot Kamachila berdasarkan harga tertinggi, harga terendah, dan harga penutupan pada hari perdagangan sebelumnya. Kemudian memfilter harga dalam kombinasi dengan indikator Bollinger Bands untuk menghasilkan sinyal perdagangan ketika harga menembus titik pivot.
Prinsip Strategi
- Hitung harga tertinggi, harga terendah, dan harga penutupan hari sebelumnya
- Perhitungan sumbu Kamachira berdasarkan rumus, yang terdiri dari lintasan atas H4, H3, H2, H1 dan lintasan bawah L1, L2, L3 dan L4
- Perhitungan tanggal 20 Brin naik dan turun
- Ketika harga naik, lakukan lebih banyak, dan ketika turun, lakukan lebih sedikit.
- Stop loss terletak di dekat jalur atas atau bawah di Brin Belt
Analisis Keunggulan
- Axis Kamachila berisi beberapa titik resistensi pendukung utama untuk meningkatkan keandalan sinyal perdagangan
- Kombinasi dengan indikator Brin, dapat memfilter penembusan palsu secara efektif
- Kombinasi multi-parameter, fleksibilitas perdagangan
Analisis risiko
- Setting parameter indikator pita Brin yang tidak tepat dapat menyebabkan kesalahan sinyal perdagangan
- Nilai pivotal pada sumbu Kamachila bergantung pada harga pada hari perdagangan sebelumnya, yang dapat dipengaruhi oleh overnight jump
- Operasi multi-headed drone memiliki risiko kerugian.
Arah optimasi
- Optimalkan parameter Brinet untuk mencari kombinasi parameter optimal
- Kombinasi dengan indikator lain untuk memfilter sinyal penembusan palsu
- Meningkatkan strategi stop loss dan mengurangi kerugian tunggal
Meringkaskan
Strategi ini menggunakan kombinasi indikator KAMACHILA AXIS dan BRIIN BAND untuk menghasilkan sinyal perdagangan ketika harga menembus titik resistensi pendukung utama. Kemampuan untuk meningkatkan profitabilitas dan stabilitas strategi dapat dicapai dengan pengoptimalan parameter dan pemfilteran sinyal. Secara keseluruhan, strategi ini memiliki ide perdagangan yang jelas, dapat dioperasikan, dan layak untuk diuji di lapangan.
Source
Pine
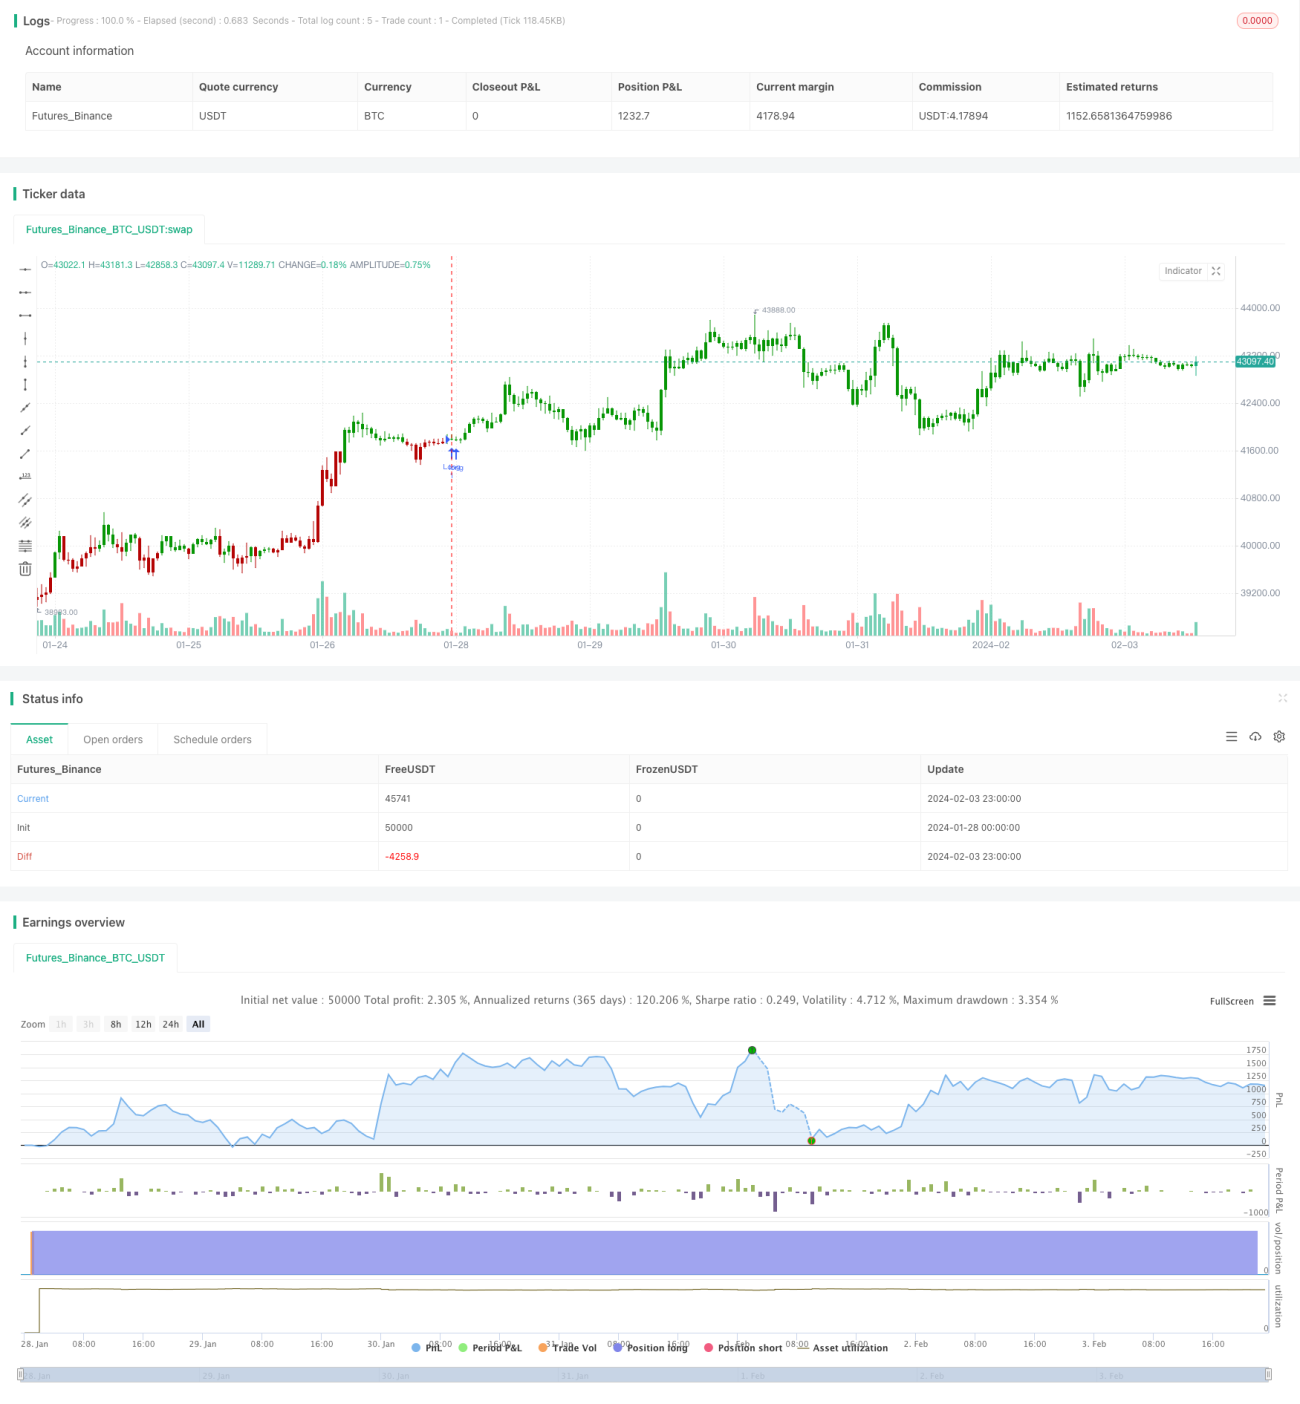
/*backtest
start: 2024-01-28 00:00:00
end: 2024-02-04 00:00:00
period: 1h
basePeriod: 15m
exchanges: [{"eid":"Futures_Binance","currency":"BTC_USDT"}]
*/

//@version=4
////////////////////////////////////////////////////////////
//  Copyright by HPotter v1.0 12/05/2020
// Camarilla pivot point formula is the refined form of existing classic pivot point formula. Strategy parameters
Related strategies
Comment
All comments (0)
No data
- 1