Strategi momentum terobosan berdasarkan pergerakan rata-rata golden cross
Ringkasan
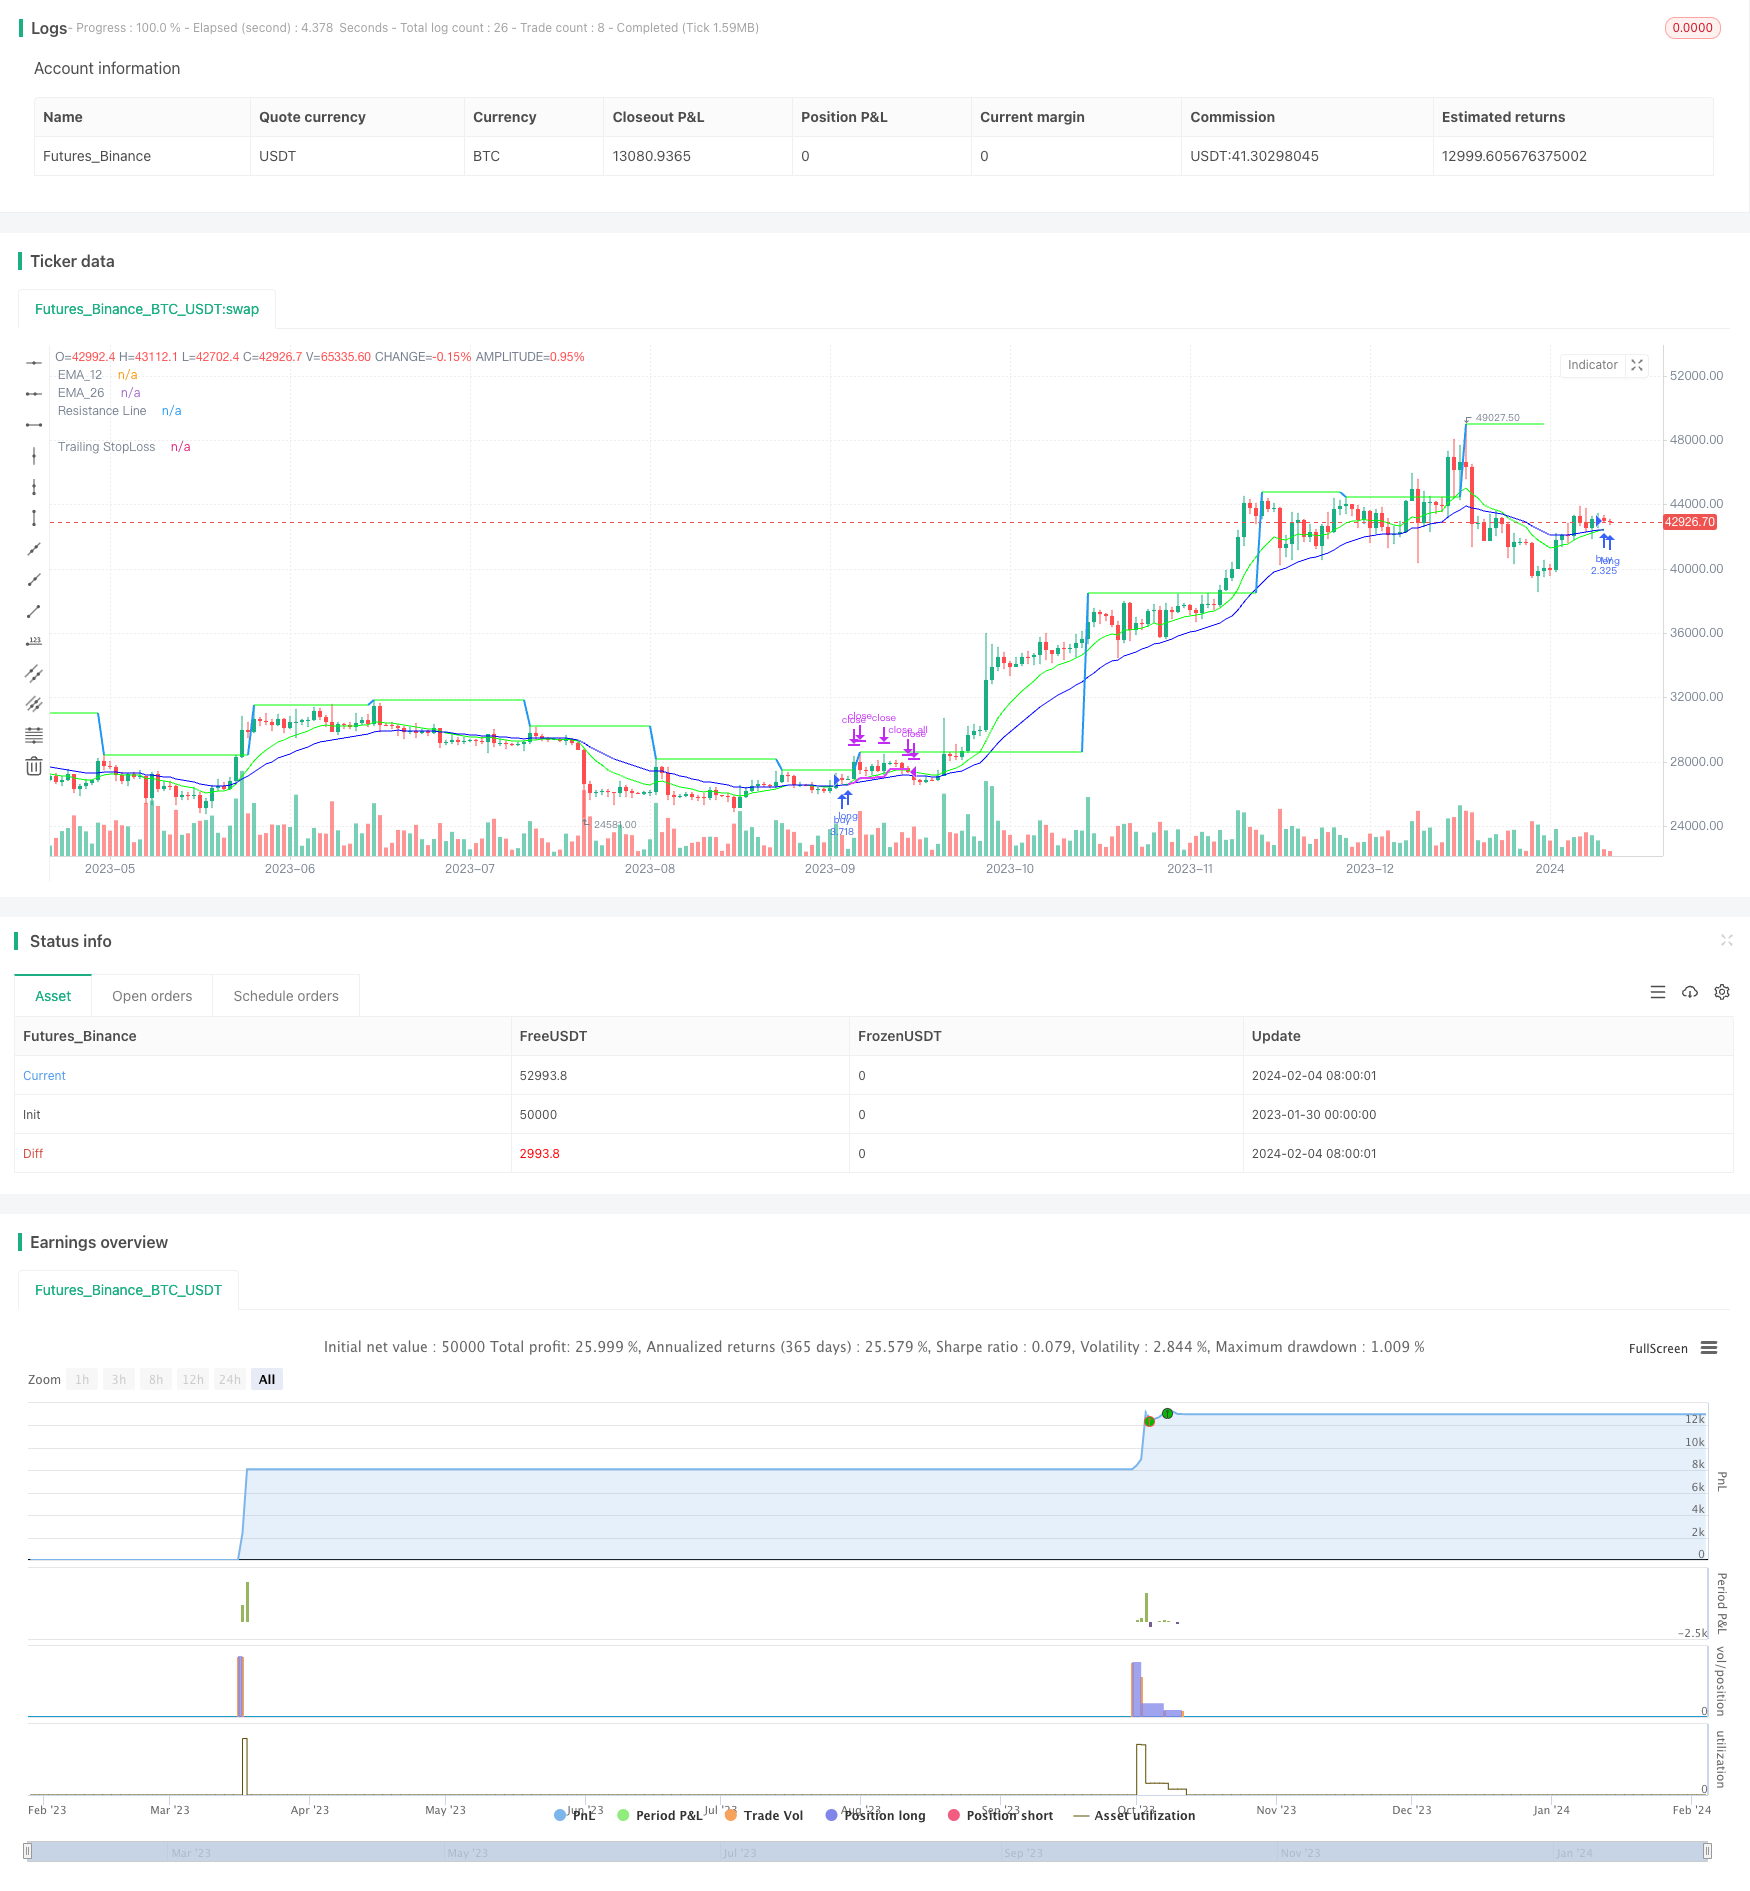
Strategi ini didasarkan pada indeks moving average 12 hari (EMA) dan EMA 26 hari sebagai sinyal masuk. Untuk menyaring terobosan palsu, strategi ini juga memperkenalkan indikator MACD untuk menilai tren pasar dan indikator RSI untuk menilai apakah ada di zona overbought oversold. Strategi ini juga menilai apakah harga telah menembus resistensi untuk mengkonfirmasi tren.
Dalam hal stop loss, strategi ini menawarkan tiga pilihan: stop tracking, stop linear, dan stop linear. Dalam hal stop loss, strategi ini menawarkan dua target stop loss berurutan.
Prinsip Strategi
Sinyal masuk
- 12 EMA di atas 26 EMA membentuk garpu emas
- MACD adalah positif dan MACD lebih tinggi dari sinyal
- Nilai RSI berada di antara kisaran yang ditetapkan
- Penutupan lebih tinggi dari EMA 21 dan SMA 7
Pengakuan Masuk
- Opsional: Harga menembus level resistensi dinamis
Cara menghentikan kerugian
- Tracking Stop Loss: Berdasarkan harga masuk dan persentase Tracking Stop Loss yang ditetapkan Tracking Set Stop Loss
- Stop loss rata-rata: harga penutupan turun dari stop loss SMA 7
- Fork mati rata-rata: 12 hari di bawah EMA melewati 26 hari EMA stop loss
Metode penghentian
- Tetapkan dua target stop order, menjual sebagian jumlah ketika stop order pertama dipicu, dan menjual seluruh jumlah ketika stop order kedua dipicu
Keunggulan Strategis
- Sistem penyaringan rata-rata menggunakan sinyal yang menyesatkan untuk meningkatkan akurasi masuk
- Berbagai pilihan stop loss untuk berbagai jenis trader
- Tracking Stop Loss Dinamis untuk Mengendalikan Risiko
- Target untuk menang dalam beberapa pertandingan dan mengunci sebagian keuntungan
Risiko Strategis
- Indikator EMA lebih sering menghasilkan sinyal palsu saat pasar bergejolak
- Tracking stop loss mungkin akan terdeteksi setelah terdeteksi
- Stop loss forks rata-rata tidak dapat dihentikan tepat waktu ketika tren berbalik
Tindakan yang disesuaikan:
- Indikator MACD untuk menilai tren pasar
- Menyesuaikan besarnya tracking stop loss
- Opsional atau kombinasi stop loss
Arah optimasi strategi
- Optimalisasi parameter EMA untuk menentukan kombinasi parameter terbaik
- Uji coba berbagai metode dan parameter penghentian untuk menemukan solusi terbaik
- Uji parameter hambatan yang berbeda untuk mengoptimalkan hambatan
- Kombinasi dengan indikator lain untuk menentukan waktu masuk
- Beradaptasi dengan varietas dan parameter siklus
Meringkaskan
Strategi ini menggunakan sistem linier sebagai sinyal perdagangan utama, membantu untuk masuk dengan MACD, RSI dan indikator lainnya untuk memfilter. Metode stop loss dan tujuan stop loss telah disetel secara optimal, dapat disesuaikan dengan parameter untuk mencocokkan berbagai jenis investor. Ruang untuk mengoptimalkan strategi masih sangat luas, dapat diuji dan diperbaiki dari beberapa dimensi seperti sinyal masuk, metode stop loss, dan tujuan stop loss, sehingga efektifitas strategi lebih baik.
/*backtest
start: 2023-01-30 00:00:00
end: 2024-02-05 00:00:00
period: 1d
basePeriod: 1h
exchanges: [{"eid":"Futures_Binance","currency":"BTC_USDT"}]
*/

// This source code is subject to the terms of the Mozilla Public License 2.0 at https://mozilla.org/MPL/2.0/
// © AbdulRahimShama
//@version=5


strategy('12/26-IT strategy', overlay=true,initial_capital = 100000)


Show_Only_12_26_Crossover_Entry = input.bool(true, group = "Entry_Exit Criteria")
Show_12_26_Crossover_and_resistance_Entry = input.bool(false, group = "Entry_Exit Criteria")


Show_TSL_StopLoss = input.bool(true, group = "Entry_Exit Criteria")
Show_Crossdown_StopLoss = input.bool(true, group = "Entry_Exit Criteria")
Show_SMA7_StopLoss = input.bool(false, group = "Entry_Exit Criteria")


////////////////////////////////////////////////
////////////////TARGETS INPUT
////////////////////////////////////////////////

////////Target1

TargetPerc1 = input.float(title="Target (%)", minval=0,defval=5, group="Target-1") / 100
TargetPrice1 = strategy.position_avg_price * (1 + TargetPerc1)
Target1_exit_qty = input.int(50, group="Target-1",tooltip = "% qty to sell when Target1 is reached")


////////Target2

TargetPerc2 = input.float(title="Target (%)", minval=0,defval=10, group="Target-2") / 100
TargetPrice2 = strategy.position_avg_price * (1 + TargetPerc2)
Target2_exit_qty = input.int(100, group="Target-2",tooltip = "% qty to sell when Target2 is reached")


////////////////////////////////////////////////
////////////////TRAILING STOP LOSS
////////////////////////////////////////////////


TSLsource = input(low, title="TSL Source", group="Trailing StopLoss")

longTrailPerc = input.float(title='Trail Long Loss (%)', minval=0.0, step=0.1, defval=1, group="Trailing StopLoss") * 0.01

TrailStopPrice = 0.0

TrailStopPrice := if strategy.position_size > 0
    sPIVOT_highValue = TSLsource * (1 - longTrailPerc)
    math.max(sPIVOT_highValue, TrailStopPrice[1])
else
    0

TSL = close < TrailStopPrice
plot(series=strategy.position_size > 0 and Show_TSL_StopLoss ? TrailStopPrice : na, color=color.new(color.fuchsia, 0), style=plot.style_linebr, linewidth=2, title='Trailing StopLoss')


////////////////////////////////////////////////
////////////////Moving Averages
////////////////////////////////////////////////


EMA_12=ta.ema(close, 12)
EMA_26=ta.ema(close, 26)
EMA_21=ta.ema(close,21)

plot(EMA_12, title="EMA_12", color=color.rgb(0, 255, 0), offset=0, linewidth=1)
plot(EMA_26, title="EMA_26", color=color.rgb(0, 0, 255), offset=0, linewidth=1)
plot(Show_SMA7_StopLoss ? ta.sma(close,7) : na, title="SMA_7", color=color.rgb(255, 0, 0), offset=0, linewidth=1)


////////////////////////////////////////////////
////////////////RESISTANCE INPUT and PLOTTING
////////////////////////////////////////////////

CrossOverLookbackCandles = input.int(10, group= "RESISTANCE")

resistanceSRC = input(high, group= "RESISTANCE")
resistanceLEFT = input(10, group= "RESISTANCE")
resistanceRIGHT = input(10, group= "RESISTANCE")

hih = ta.pivothigh(resistanceSRC, resistanceLEFT, resistanceRIGHT)
top = ta.valuewhen(hih, resistanceSRC[resistanceRIGHT], 0)

res = plot(top, color=top != top[1] ? na : color.new(#00ff00, 50), offset=-resistanceLEFT, linewidth=2, title="Resistance Line")

EMA_12_Low = ta.lowest(EMA_12, CrossOverLookbackCandles)
EMA_26_Low = ta.lowest(EMA_26, CrossOverLookbackCandles)


////////////////////////////////////////////////
////////////////RSI INPUT and PLOTTING
////////////////////////////////////////////////
RSI = ta.rsi(close, 14)
RSILowerRange = input.int(50, tooltip = "RSI value should be ABOVE this value for entry", group = "RSI")
RSIUpperRange = input.int(70, tooltip = "RSI value should be BELOW this value for entry", group = "RSI")


////////////////////////////////////////////////
////////////////MACD
////////////////////////////////////////////////
fast_length = 12
slow_length = 26
MACD_src = close
signal_length = 9

fast_ma = ta.ema(MACD_src, fast_length)
slow_ma = ta.ema(MACD_src, slow_length)
macd = fast_ma - slow_ma
signal = ta.ema(macd, signal_length)
hist = macd - signal


////////////////////////////////////////////////
////////////////ENTRY CRITERIA
////////////////////////////////////////////////


BUYVALUE= input(100000, tooltip = "Buy qty displayed on chart will be based on this value")

BASEENTRY = macd > signal and RSI > RSILowerRange and RSI < RSIUpperRange and close > EMA_21 and close > ta.sma(close, 7)


Entry= ta.crossover(EMA_12, EMA_26) and BASEENTRY
Entry2 = ta.crossover(close, top) and EMA_12_Low < EMA_26_Low and EMA_12 > EMA_26 and RSI < 70

////////////////////////////////////////////////
////////////////BUY SELL STRATEGY
////////////////////////////////////////////////

if ((Entry and Show_Only_12_26_Crossover_Entry))
    strategy.entry("buy", strategy.long, qty=BUYVALUE/close)

if (Entry2 and Show_12_26_Crossover_and_resistance_Entry)
    strategy.entry("buy", strategy.long, qty=BUYVALUE/close)

strategy.exit("Tg1", "buy", limit=TargetPrice1, qty_percent = Target1_exit_qty)
strategy.exit("Tg2", "buy", limit=TargetPrice2, qty_percent = Target2_exit_qty)


if TSL and Show_TSL_StopLoss and close < EMA_12
    strategy.close_all ("sl")

if ta.crossunder(EMA_12, EMA_26) and Show_Crossdown_StopLoss
    strategy.close_all ("sl")

if ta.crossunder(close, ta.sma(close, 7)) and Show_SMA7_StopLoss
    strategy.close_all ("sl")