Strategi Jangka Panjang Indikator Tren Besar

Ringkasan
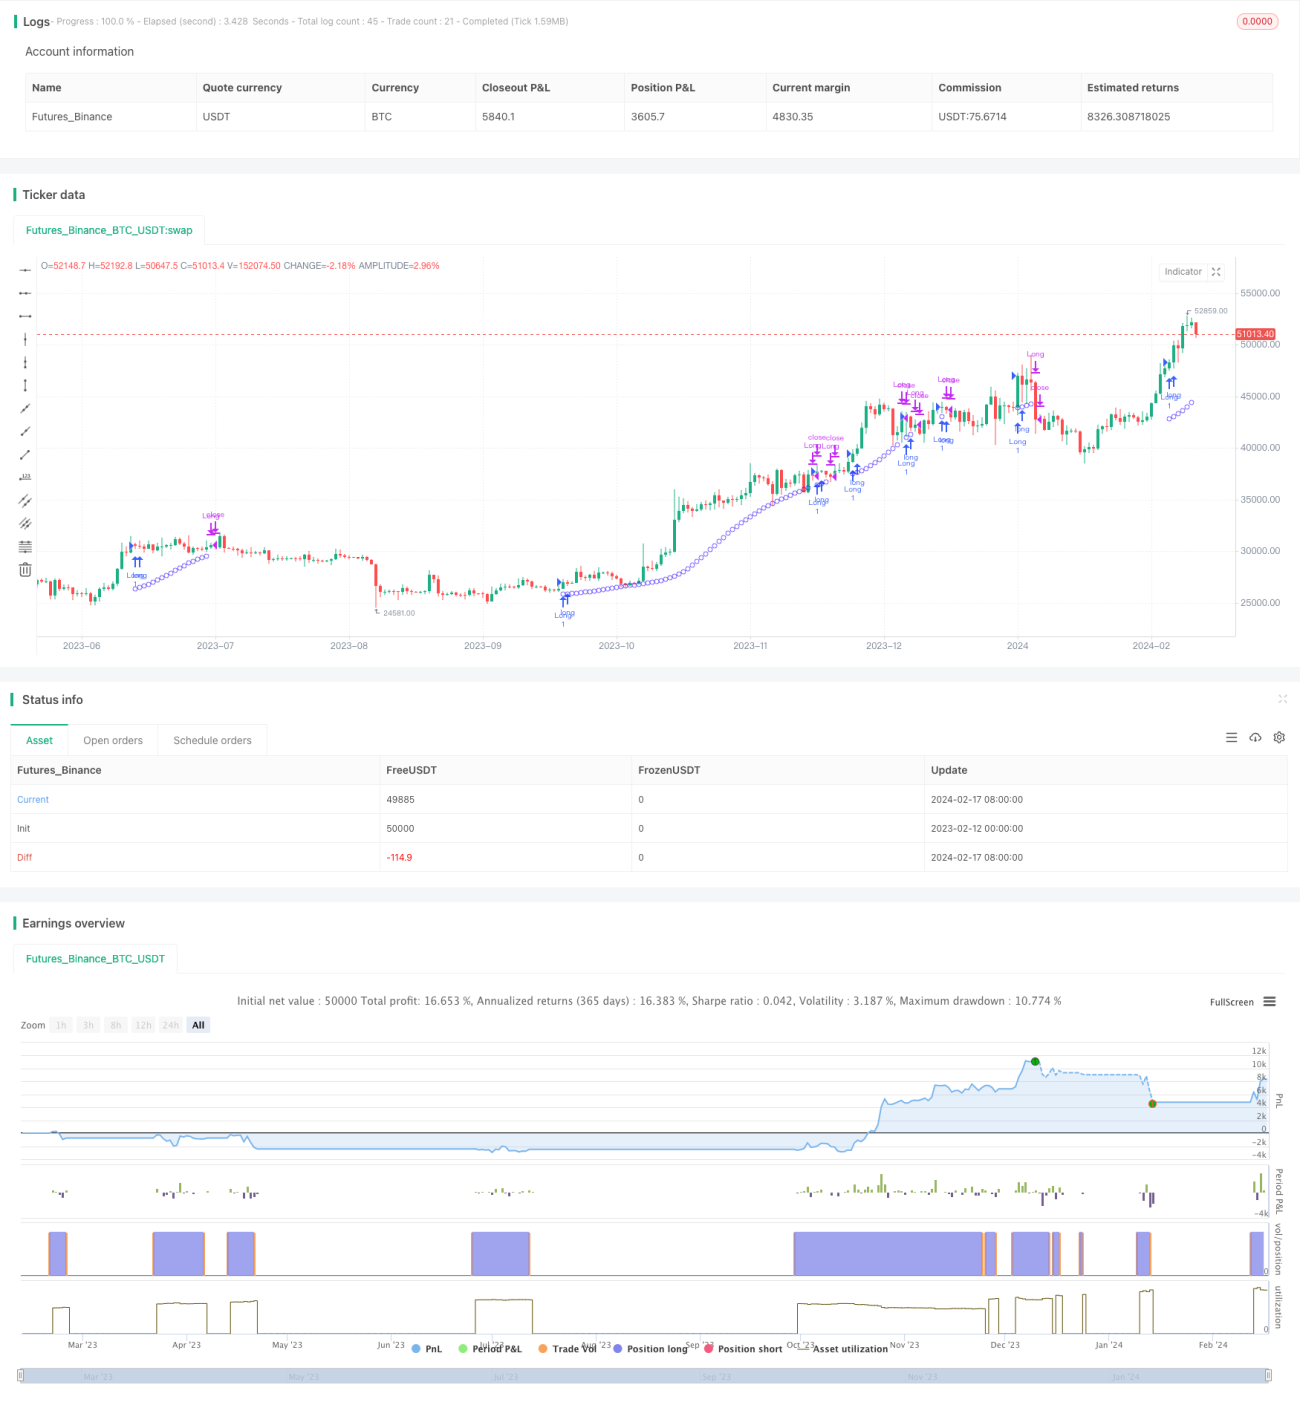
Major Trend Indicator Long (MTIL) adalah strategi perdagangan yang digunakan untuk berbagai instrumen keuangan (termasuk cryptocurrency Bitcoin, Ethereum, dan saham tradisional seperti Apple Inc.). Ini dirancang untuk mengidentifikasi potensi tren multi-head sehingga Anda dapat membuat posisi panjang.
Prinsip Strategi
Strategi MTIL menggunakan parameter yang dioptimalkan untuk menghitung harga tertinggi dan harga terendah dalam periode revisi tertentu. Kemudian, metode regresi linier diterapkan untuk memperlancar data harga, mengidentifikasi potensi tren bull market, dan mengirimkan sinyal multipel.
Secara khusus, strategi ini pertama-tama menghitung harga tertinggi dan terendah dalam periode tertentu. Kemudian, regresi linier menggunakan parameter yang berbeda untuk meluruskan harga tertinggi dan terendah. Ini akan menghasilkan tren naik dan tren turun.
Analisis Keunggulan
Strategi MTIL memiliki keuntungan sebagai berikut:
- Menggunakan teknik identifikasi dual smoothed tren, akurasi yang lebih tinggi
- Waktu awal retrospektif dapat disesuaikan untuk menguji kinerja historis strategi
- Parameter yang dapat disesuaikan dengan preferensi trading Anda
- Dapat digabungkan dengan strategi overhead untuk analisis multi-aksel waktu
Analisis risiko
Strategi MTIL juga memiliki risiko sebagai berikut:
- Perdagangan tren berisiko tinggi, kemungkinan kerugian yang lebih besar
- Setting parameter yang tidak benar dapat menyebabkan kehilangan kesempatan atau sinyal yang salah
- Pertimbangan yang tepat untuk biaya transaksi, menghindari terlalu sering transaksi
Beberapa risiko dapat dihindari dengan menyesuaikan parameter, mengatur stop loss, dan mengontrol biaya transaksi.
Arah optimasi
Strategi MTIL dapat dioptimalkan dalam beberapa hal:
- Uji kombinasi parameter siklus yang berbeda untuk mencari parameter optimal
- Meningkatkan mekanisme konfirmasi harga untuk menghindari sinyal yang salah
- Dalam kombinasi dengan indikator lain seperti penilaian dan pergerakan waktu, sinyal dikonfirmasi lebih lanjut.
- Menetapkan strategi stop loss dan stop loss untuk mengendalikan kerugian tunggal dan keuntungan keseluruhan
Meringkaskan
MTIL adalah strategi multi-head yang menggunakan teknik regresi linier untuk mengidentifikasi tren besar. Ini dapat diterapkan pada lingkungan pasar yang berbeda melalui penyesuaian parameter.
- 1