Strategi referensi untuk tren naik yang menembus batas
Ringkasan
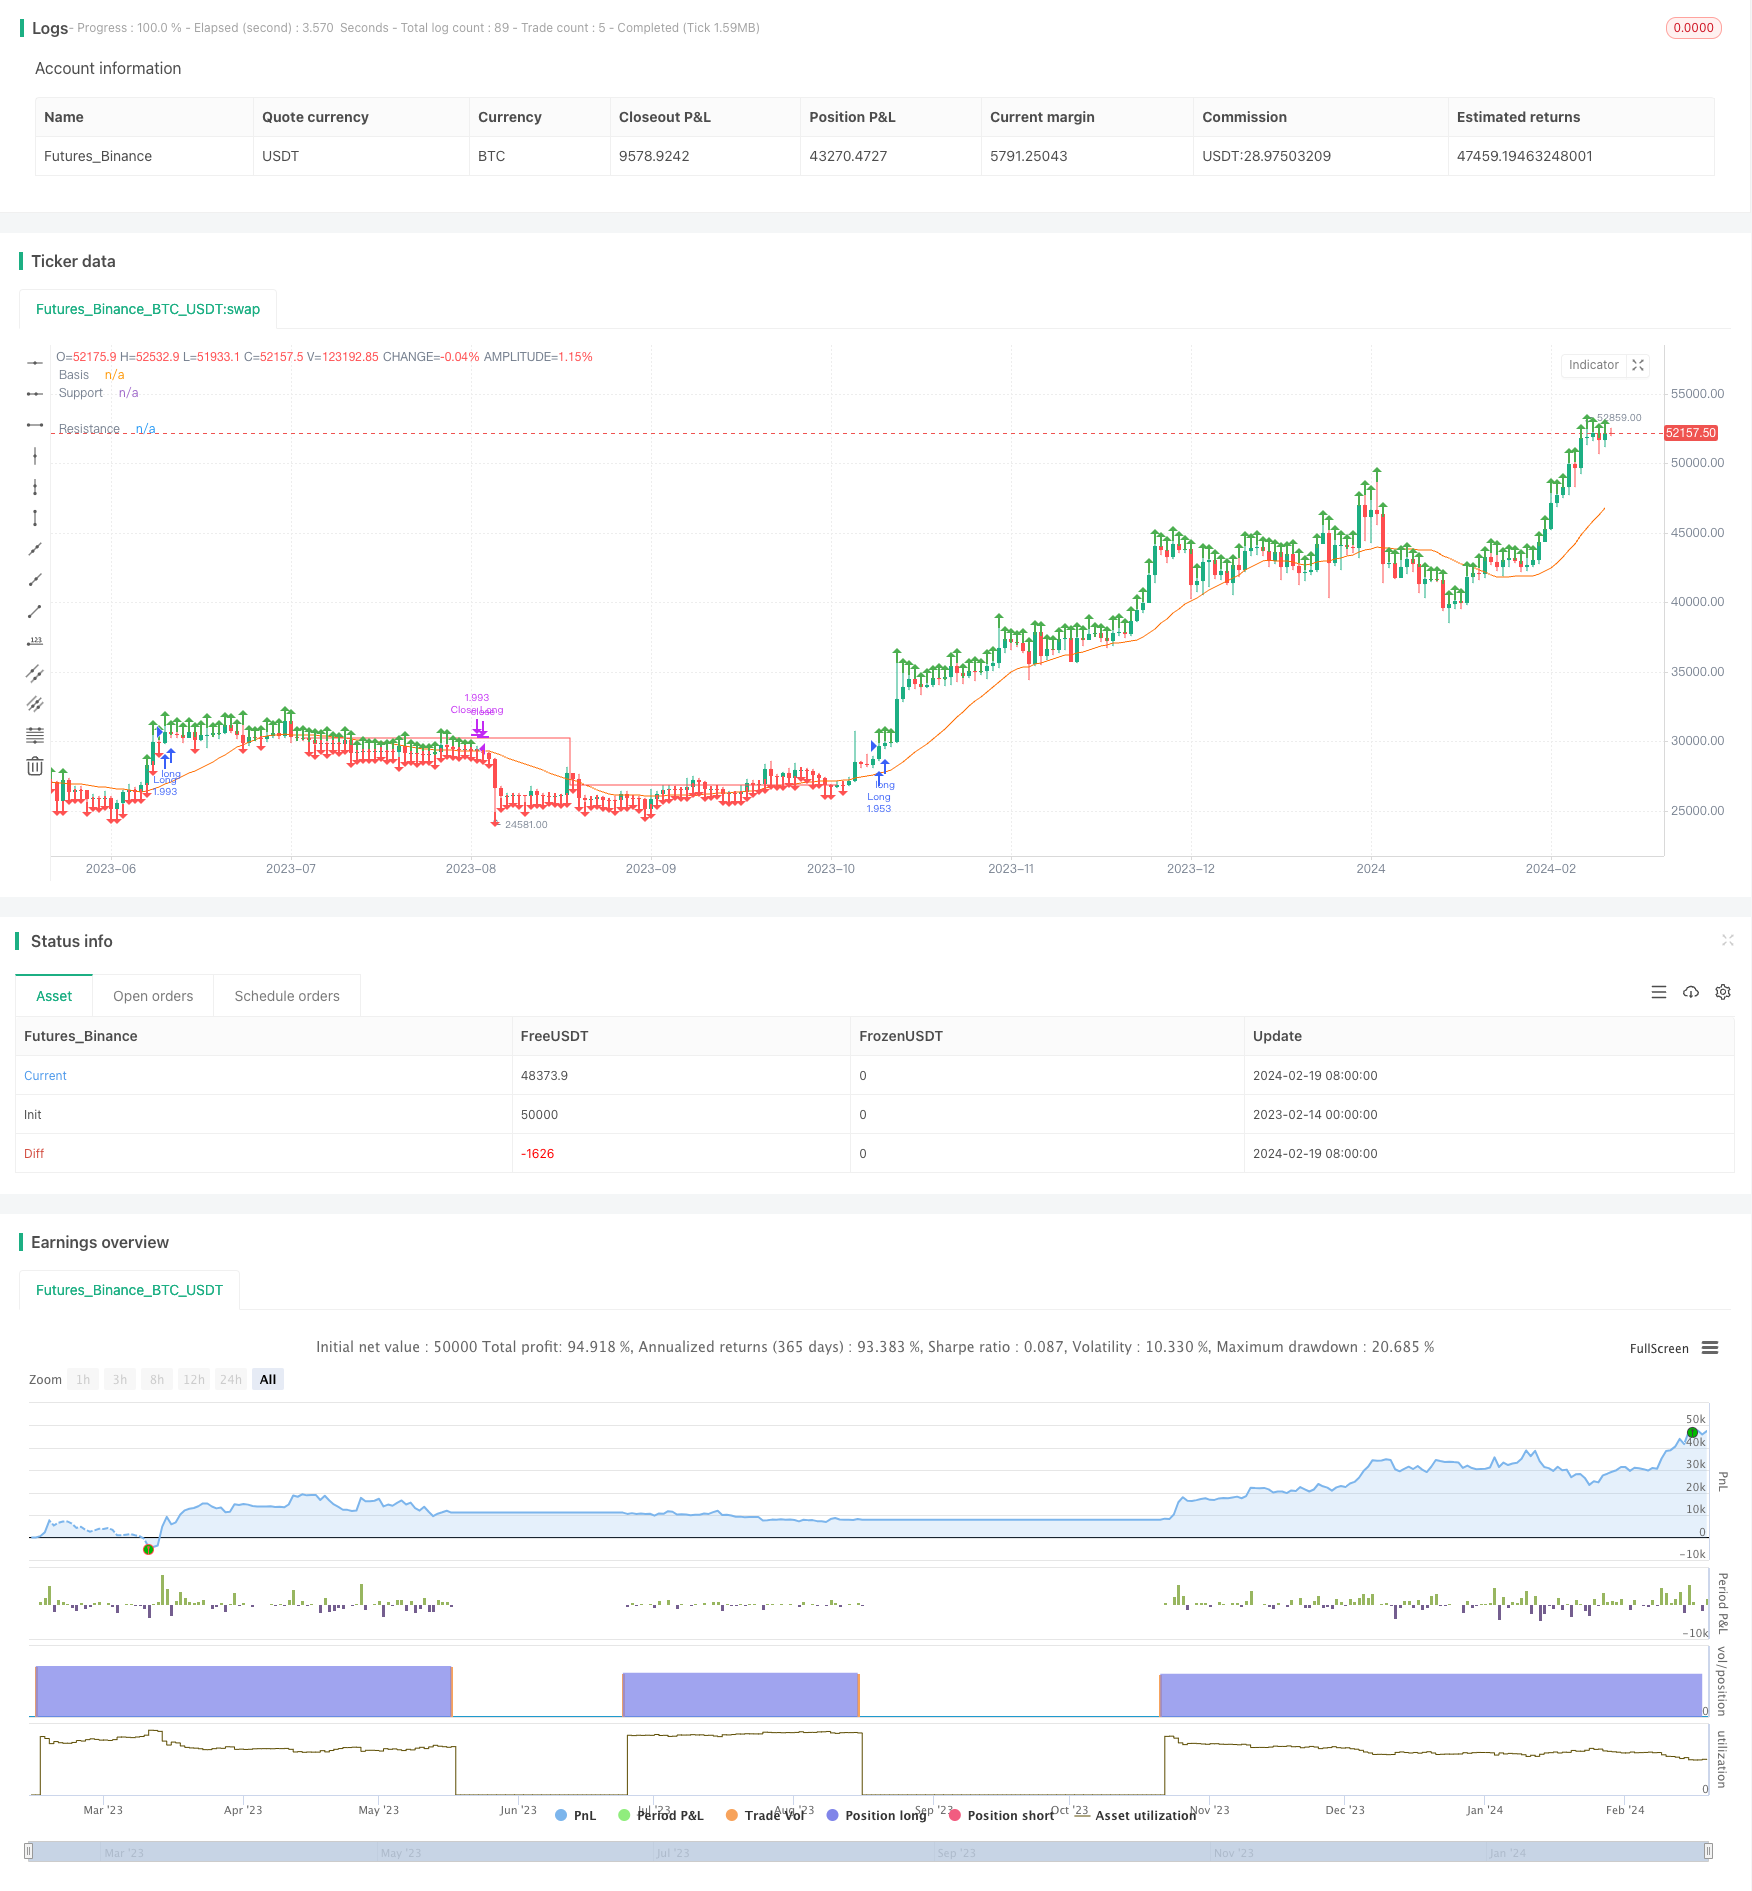
Strategi ini adalah strategi memegang posisi panjang yang didasarkan pada arah tren yang ditentukan oleh rata-rata bergerak sederhana, yang dikombinasikan dengan resistance support line yang membentuk sinyal untuk menembus. Dengan menghitung harga Pivot High dan Pivot Low, garis resistensi dan garis dukungan dipetakan, dan posisi yang lebih rendah ketika harga menembus resistance line, dan posisi yang lebih rendah ketika harga menembus support line.
Prinsip Strategi
- Perhitungan rata-rata bergerak sederhana 20 hari sebagai garis dasar untuk menilai tren
- Pivot Highs dan Pivot Lows dihitung berdasarkan parameter input pengguna
- Menggambar resistance line dan support line berdasarkan Pivot high dan Pivot low
- Ketika harga close-out berada di atas resistance line, lakukan over entry
- Ketika dukungan di bawah garis melewati garis resistensi, posisi kosong
Strategi ini menggunakan rata-rata bergerak sederhana untuk menentukan arah tren secara keseluruhan, kemudian menggunakan titik kunci untuk membuat sinyal perdagangan, dan merupakan strategi jenis terobosan yang khas. Dengan titik kunci dan penilaian tren, Anda dapat secara efektif memfilter terobosan palsu.
Analisis Keunggulan
- Ada banyak peluang strategi yang cocok untuk saham yang berfluktuasi tinggi dan mudah menangkap tren.
- Pengendalian risiko: resiko lebih besar dari keuntungan
- Menggunakan sinyal penembusan untuk menghindari risiko penembusan palsu
- Parameter yang dapat disesuaikan, beradaptasi
Analisis risiko
- Bergantung pada optimasi parameter, parameter yang salah akan meningkatkan probabilitas penembusan palsu
- “Sinyal penembusan terlambat, kemungkinan kehilangan beberapa kesempatan”.
- Kerusakan akibat gempa bumi
- Ada beberapa alasan mengapa Anda harus beradaptasi dengan garis dukungan.
Risiko dapat dikurangi dengan mengoptimalkan parameter dari hard disk, dikombinasikan dengan strategi stop loss.
Arah optimasi
- Mengoptimalkan parameter siklus rata-rata bergerak
- Optimalkan parameter resistance line dukungan
- Meningkatkan strategi stop loss
- Menambahkan mekanisme konfirmasi terobosan
- Sinyal penyaring indikator seperti volume transaksi
Meringkaskan
Strategi ini secara keseluruhan adalah strategi tipe terobosan yang khas, bergantung pada optimasi parameter dan likuiditas, cocok untuk pedagang yang mengikuti tren. Sebagai kerangka acuan, dapat diperluas sesuai dengan kebutuhan nyata, mengurangi risiko dan meningkatkan stabilitas melalui mekanisme seperti stop loss, sinyal filter, dll.
/*backtest
start: 2023-02-14 00:00:00
end: 2024-02-20 00:00:00
period: 1d
basePeriod: 1h
exchanges: [{"eid":"Futures_Binance","currency":"BTC_USDT"}]
*/

// This source code is subject to the terms of the Mozilla Public License 2.0 at https://mozilla.org/MPL/2.0/
// © CheatCode1

//@version=5
strategy("Quantitative Trend Strategy- Uptrend long", 'Steady Uptrend Strategy', overlay=true, initial_capital = 1500, default_qty_value = 100, commission_type = strategy.commission.percent, commission_value = 0.01, default_qty_type = strategy.percent_of_equity)


length = input.int(20, minval=1)
src = input(close, title="Source")
basis = ta.sma(src, length)
offset = input.int(0, "Offset", minval = -500, maxval = 500)
plot(basis, "Basis", color=#FF6D00, offset = offset)

inp1 = input.int(46, 'LookbackLeft')
inp2 = input.int(32, 'LookbackRight')

l1 = ta.pivothigh(close, inp1, inp2)
S1 = ta.pivotlow(close, inp1, inp2)

// plot(l1, 'Pivothigh', color.red, 1)
// // plot(S1, 'Pivot Low', color.red)

l1V = ta.valuewhen(l1, close, 0)
S1V = ta.valuewhen(S1, close, 0)

Plotl1 = not na(l1) ? l1V : na
PlotS1 = not na(S1) ? S1V : na

plot(Plotl1, 'Resistance', color.green, 1, plot.style_stepline, true)
plot(PlotS1, 'Support', color.red, 1, plot.style_stepline, true)

Priceforlong = close > l1V ? true : na
Priceforshort = close < S1V ? true : na

plotshape(Priceforlong ? high : na, 'p', shape.arrowup, location.abovebar, color.green, size = size.small)
plotshape(Priceforshort ? low : na, 's', shape.arrowdown, location.belowbar, color.red, size = size.small)

vol = volume
volma = ta.sma(vol, 20)

Plotl1C = ta.valuewhen(na(Plotl1), l1V, 0)
PlotS1C = ta.valuewhen(na(PlotS1), S1V, 0)
//Strategy Execution
volc = volume > volma

Lc1 = Priceforlong

Sc1 = Priceforshort

sL = Plotl1 < PlotS1 ? close : na
sS = PlotS1 > Plotl1 ? close : na


if Lc1
    strategy.entry('Long', strategy.long)
// if Sc1 and C2
//     strategy.entry('Short', strategy.short)

if Priceforshort
    strategy.cancel('Long')
if Priceforlong
    strategy.cancel('Short')


// Stp1 = ta.crossover(k, d)
// Ltp1 = ta.crossunder(k, d)
// Ltp = d > 70  ? Ltp1 : na
// Stp = d < 30  ? Stp1 : na


if strategy.openprofit >= 0 and sL
    strategy.close('Long')
if strategy.openprofit >= 0 and sS
    strategy.close('Short')
takeP = input.float(2, title='Take Profit') / 100
stopL = input.float(1.75, title='Stop Loss') / 100


// // Pre Directionality

Stop_L = strategy.position_avg_price * (1 - stopL)

Stop_S = strategy.position_avg_price * (1 + stopL)

Take_S= strategy.position_avg_price * (1 - takeP)

Take_L = strategy.position_avg_price * (1 + takeP)

// sL = Plotl1 < PlotS1 ? close : na
// sS = PlotS1 < Plotl1 ? close : na

// //Post Excecution
if strategy.position_size > 0 and not (Lc1)
    strategy.exit("Close Long", stop = Stop_L, limit = Take_L)

if strategy.position_size < 0 and not (Sc1)
    strategy.exit("Close Short", stop = Stop_S, limit = Take_S)