Strategi pelacakan tren terobosan garis ganda golden cross dan death cross
Ringkasan
Strategi ini secara komprehensif mempertimbangkan harga dalam berbagai periode waktu untuk mendukung resistensi dan bergerak rata-rata sinyal Gold Fork Dead Fork, menangkap dukungan dan resistensi yang penting saat harga menembus, digabungkan dengan filter indikator tren untuk membuat banyak peluang kosong, untuk mencapai posisi awal perubahan tren, dan melacak tren garis panjang.
Prinsip Strategi
Strategi ini terdiri dari empat bagian utama:
- Garis dukungan yang ditetapkan dalam 30 hari
- Resistance line dengan titik tertinggi dalam 30 minggu
- 10 Simple Moving Average, digunakan untuk mengkonfirmasi trend dan memfilter sinyal perdagangan
- Menembus modul Identification, mengidentifikasi peluang perdagangan di mana harga menembus titik-titik resistensi pendukung yang penting
Secara khusus, strategi pertama menggunakan fungsi Security untuk mendapatkan harga tertinggi dan terendah selama 30 hari dan 30 minggu, untuk menentukan garis dukungan dan garis resistensi yang dinamis. Kemudian, kombinasi sinyal garpu emas dan garpu mati dari rata-rata bergerak 10 hari untuk memfilter peluang perdagangan yang pecah.
Strategi ini memperhitungkan dukungan dan resistensi pada garis tengah dan garis panjang untuk menangkap peluang tren yang lebih besar. Dengan kombinasi rata-rata bergerak, ini secara efektif memfilter sinyal yang salah dalam tren yang bergoyang.
Analisis Keunggulan
Strategi ini memiliki beberapa keuntungan:
- Pada saat yang sama memanfaatkan garis pendek dan garis panjang yang mendukung titik resistensi, dapat menangkap lebih besar terobosan.
- Meningkatkan filter rata-rata bergerak untuk mengontrol kerugian secara efektif dan menghindari sinyal yang salah dalam getaran.
- Pembaruan dinamis mendukung titik resistensi, sehingga dapat menangkap arah tren baru tepat waktu.
- Implementasi mekanisme penghentian kerugian dengan manajemen risiko dapat membantu memastikan keuntungan.
Analisis risiko
Strategi ini juga memiliki beberapa risiko yang perlu diperhatikan:
- Strategi terobosan memiliki persyaratan yang lebih tinggi untuk mengetahui waktu transaksi, dan mudah terjadi masalah terobosan atau keterlambatan.
- Kekalahan resistance support dapat menyebabkan kesalahan sinyal dan kerugian besar.
- Rata-rata bergerak sendiri tertinggal dari harga dan mungkin akan melewatkan titik pergeseran tren.
- Investor yang memiliki modal kecil tidak cocok untuk mengambil risiko besar.
Solusi yang sesuai:
- Adaptasi logik pengenalan terobosan dengan memasukkan lebih banyak kondisi penyaringan.
- Meningkatkan parameter siklus rata-rata bergerak untuk memastikan sinyal hanya dihasilkan setelah tren stabil.
- Setting Stop Loss yang Rasional untuk Mengontrol Kerugian Tunggal
Arah optimasi
Strategi ini masih bisa dioptimalkan lebih jauh:
- Cobalah untuk menentukan stop loss yang lebih masuk akal dengan menggunakan indikator volatilitas seperti ATR.
- Menambahkan model pembelajaran mesin untuk menilai kegagalan titik-titik resistensi pendukung utama.
- Adapted Moving Average (AM) adalah sebuah metode yang digunakan untuk mengamati perubahan tren yang terjadi pada waktu yang tepat.
- Adaptasi dan optimasi untuk parameter varietas yang berbeda.
Meringkaskan
Strategi pelacakan tren Binary Breakthrough Gold Fork Dead Fork Mengambil dukungan resistance level dan indikator moving average dari garis tengah dan panjang sebagai sinyal perdagangan, dapat secara efektif menyaring kebisingan dalam konteks tren besar untuk mencapai keuntungan, merupakan strategi perdagangan kuantitatif yang lebih matang. Strategi ini masih memiliki ruang yang luas untuk pengoptimalan, dapat diperbaiki dari mekanisme stop loss, parameter penyesuaian diri, dan lain-lain, juga dapat mencoba memperkenalkan metode baru seperti pembelajaran mesin untuk meningkatkan kehandalan strategi.
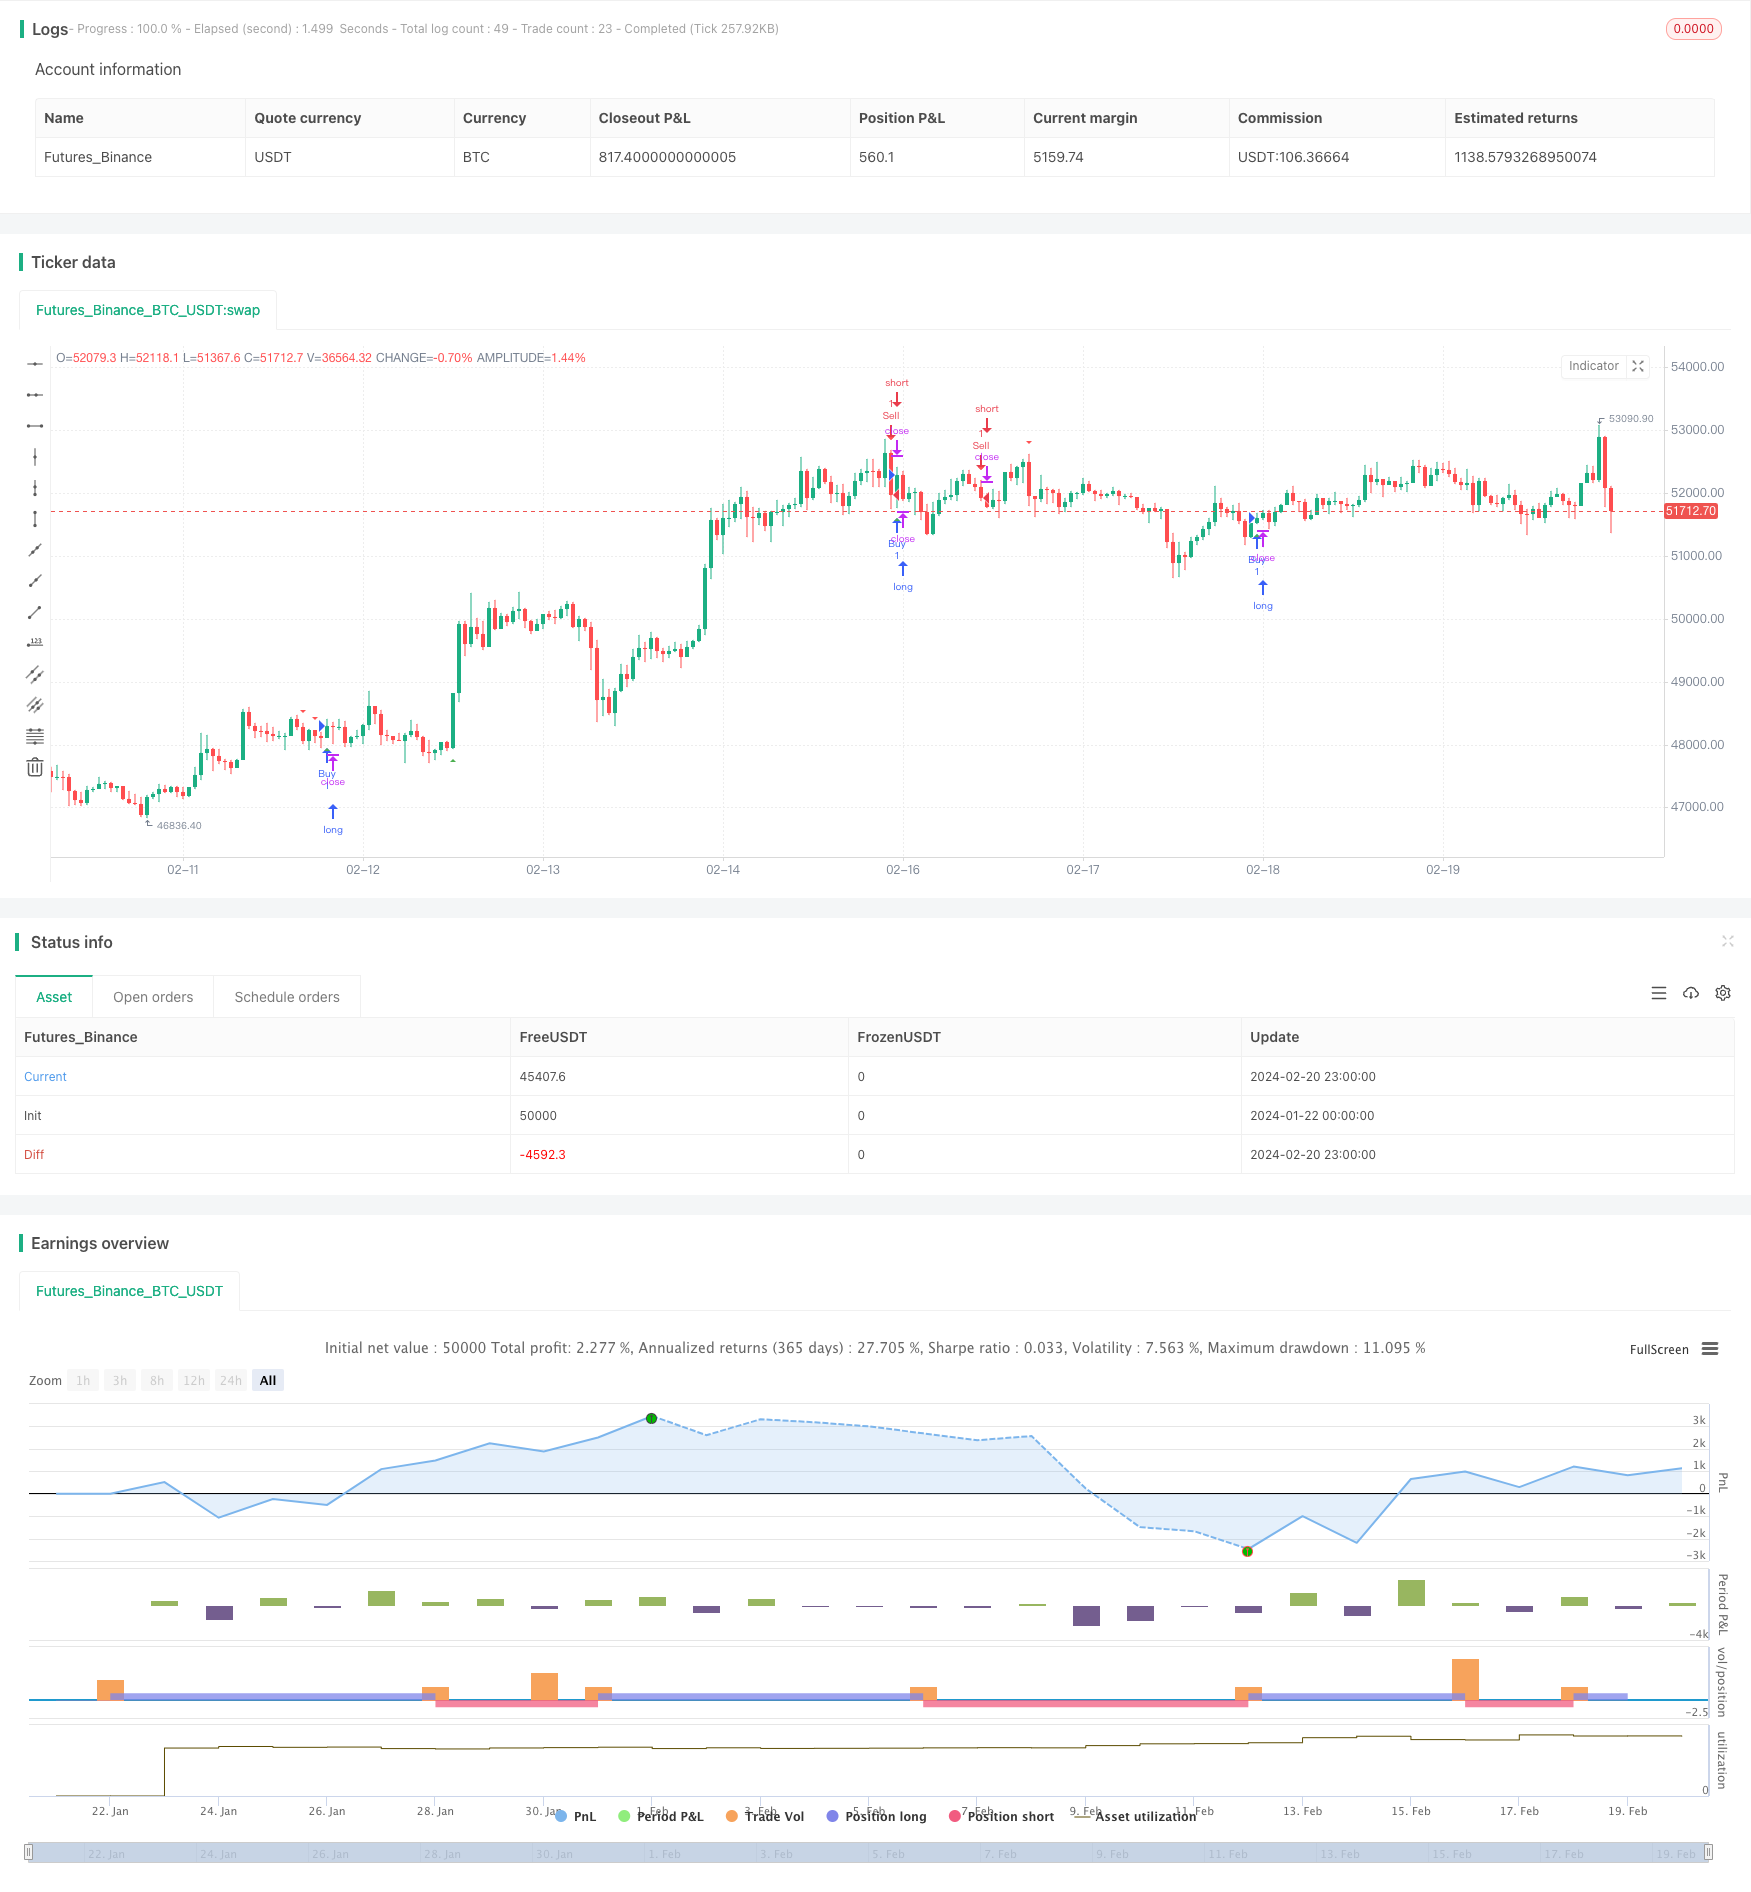
/*backtest
start: 2024-01-22 00:00:00
end: 2024-02-21 00:00:00
period: 1h
basePeriod: 15m
exchanges: [{"eid":"Futures_Binance","currency":"BTC_USDT"}]
*/

// This Pine Script™ code is subject to the terms of the Mozilla Public License 2.0 at https://mozilla.org/MPL/2.0/
// © neosaid

//@version=5
strategy("Support and resistant Strategy", overlay=true)

// Function to check for breakout
f_breakoutCondition(closingPrice, highestHigh, lowestLow) =>
    closingPrice > highestHigh or closingPrice < lowestLow

// Step 1: 30 Days Trend Line (Lower Lows)
low30Days = request.security(syminfo.tickerid, "D", low)

// Step 2: 30 Weeks Upper Trend Line (Higher Highs)
high30Weeks = request.security(syminfo.tickerid, "W", high)

// Step 3: Trend Line for Lowest Low within the Last Month
var float lowestLowLastMonth = na
for i = 0 to 29
    lowestLowLastMonth := na(lowestLowLastMonth) ? low[i] : math.min(lowestLowLastMonth, low[i])

lowestLowLastMonthValue = lowestLowLastMonth[1]

// Breakout Strategy
highestHighLast3Candles = request.security(syminfo.tickerid, "D", ta.highest(close, 3))
lowestLowLast3Candles = request.security(syminfo.tickerid, "D", ta.lowest(close, 3))

// Additional conditions to filter signals
buyCondition = f_breakoutCondition(close, highestHighLast3Candles, lowestLowLast3Candles) and close > low30Days

sellCondition = f_breakoutCondition(close, highestHighLast3Candles, lowestLowLast3Candles) and close < high30Weeks

// Additional filters to reduce the number of orders
buyFilter = ta.crossover(close, ta.sma(close, 10)) // Buy only when price crosses above a 10-period SMA
sellFilter = ta.crossunder(close, ta.sma(close, 10)) // Sell only when price crosses below a 10-period SMA

buyCondition := buyCondition and buyFilter
sellCondition := sellCondition and sellFilter

// Plot Buy and Sell signals on the chart
plotshape(series=buyCondition, title="Buy Signal", color=color.green, style=shape.triangleup, location=location.belowbar)
plotshape(series=sellCondition, title="Sell Signal", color=color.red, style=shape.triangledown, location=location.abovebar)

// Strategy entries
strategy.entry("Buy", strategy.long, when = buyCondition)
strategy.entry("Sell", strategy.short, when = sellCondition)