Strategi perdagangan multi-kerangka waktu berdasarkan indikator kompresi

Ringkasan
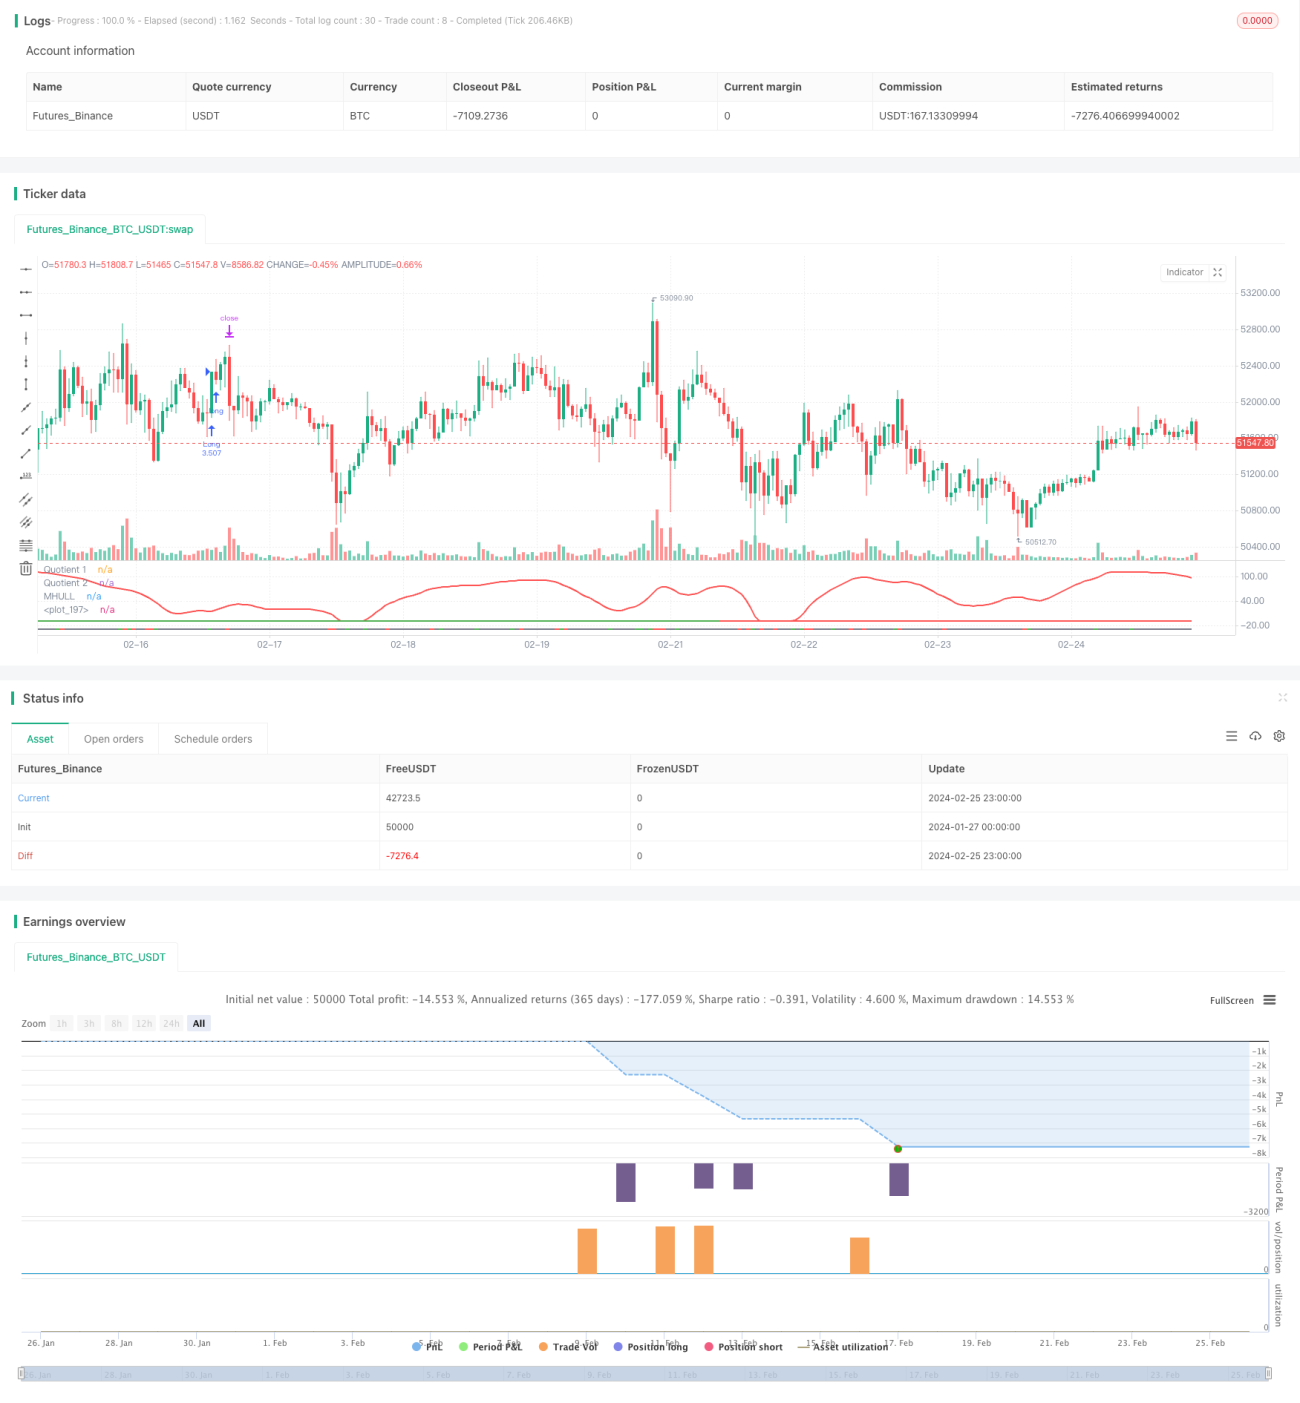
Strategi ini menggabungkan tiga indikator, yaitu Boom Hunter, Hull Suite, dan Volatility Oscillator, untuk mewujudkan strategi kuantitatif untuk melacak tren dan melakukan transaksi terobosan dalam beberapa kerangka waktu. Strategi ini berlaku untuk aset digital seperti Bitcoin yang memiliki situasi harga yang sangat fluktuatif dan mendadak.
Prinsip
Logika inti dari strategi ini didasarkan pada tiga indikator:
-
**Boom Hunter (pengembara kain)**Sebuah oscillator yang menggunakan teknik kompresi indikator untuk menilai sinyal beli dan jual melalui persilangan dua indikator (Quotient1 dan Quotient2).
-
Hull Suite (dalam bahasa Inggris): satu set indikator rata-rata bergerak halus, untuk menilai arah tren melalui hubungan antara rel tengah dan rel atas dan bawah.
-
Oscillator VolatilitasSebuah indikator oscillator yang mengukur informasi tentang pergerakan harga.
Logika masuk dari strategi ini adalah bahwa ketika dua indikator Quotient dari pemburu kain terjadi ke atas atau ke bawah, harga akan menembus rel tengah Hull dan berselisih dengan rel atas atau bawah, sementara indikator volatilitas berada di zona overbought dan oversold. Ini dapat memfilter beberapa sinyal penembusan palsu dan meningkatkan akurasi masuk.
Stop loss ditetapkan dengan mencari titik terendah atau tertinggi dalam periode tertentu (default 20 K-line), dan keuntungan diperoleh dengan stop loss persentase kali stop loss rasio yang dikonfigurasi (default 3x). Posisi dihitung berdasarkan persentase dari total aset akun (default 3%) dan stop loss untuk standar tertentu.
Keunggulan
- Menggunakan teknik kompresi indikator untuk mengekstrak sinyal perdagangan utama dalam harga untuk meningkatkan probabilitas keuntungan
- Verifikasi kombinasi multi-indikator, menghindari false breakout, dan menilai arah tren secara akurat
- Pengaturan Stop Loss Dinamis, Pelacakan Tren untuk Mengontrol Risiko
- Menggunakan indikator volatilitas untuk memastikan transaksi di lingkungan yang sangat fluktuatif
- Analisis Multi-Framework untuk Meningkatkan Stabilitas Strategi
Risiko
- Indikator pemburu kain mungkin memiliki distorsi kompresi yang menyebabkan sinyal yang salah
- Hal ini dikarenakan adanya keterlambatan dalam pelacakan paket Hull, sehingga tidak dapat melacak perubahan harga secara tepat waktu.
- Jika volatilitas turun, peluang perdagangan akan terlewatkan atau kerugian akan terjadi.
Solusi:
- Menyesuaikan parameter indikator kompresi, menyeimbangkan sensitivitas indikator
- Cobalah menggunakan moving averages seperti EHMA sebagai pengganti indikator mid-trail.
- Menambahkan indikator penilaian lain untuk menghindari ketidakpastian volatilitas
Pengoptimalan
Strategi ini dapat dioptimalkan dalam beberapa hal:
-
Optimasi parameterUntuk mendapatkan kombinasi parameter yang optimal dengan mengubah parameter indikator seperti panjang siklus, faktor kompresi, dan lain-lain
-
Pengoptimalan kerangka waktuUji siklus waktu yang berbeda (misalnya 1 menit, 5 menit, 30 menit, dan lain-lain) untuk menemukan siklus perdagangan yang paling sesuai
-
Optimalisasi Posisi: Mengubah ukuran dan proporsi posisi untuk setiap transaksi, untuk menemukan penggunaan dana yang optimal
-
Optimalisasi Stop Loss: Mengatur posisi stop loss sesuai dengan perdagangan yang berbeda, untuk mencapai rasio risiko-reward yang optimal
-
Kondisi Optimasi: Meningkatkan atau mengurangi kondisi penyaringan indikator untuk mendapatkan waktu masuk yang lebih akurat
Meringkaskan
Strategi ini memungkinkan perdagangan pelacakan tren dalam kerangka waktu yang beragam melalui kombinasi tiga indikator, yaitu Crop Hunter, Hull Suite, dan Volatility Oscillator. Strategi ini dapat secara efektif mengidentifikasi pergerakan harga yang tiba-tiba, dan berlaku untuk aset digital yang memiliki volatilitas tinggi. Strategi ini dapat dikontrol risiko, dioptimalkan dalam berbagai aspek melalui parameter, kondisi gelombang, dan stop loss, dan memiliki kemampuan operasional dan skalabilitas yang kuat.
- 1