Strategi perdagangan kombinasi penutupan tiga pita BB dan indikator RSI
Ringkasan
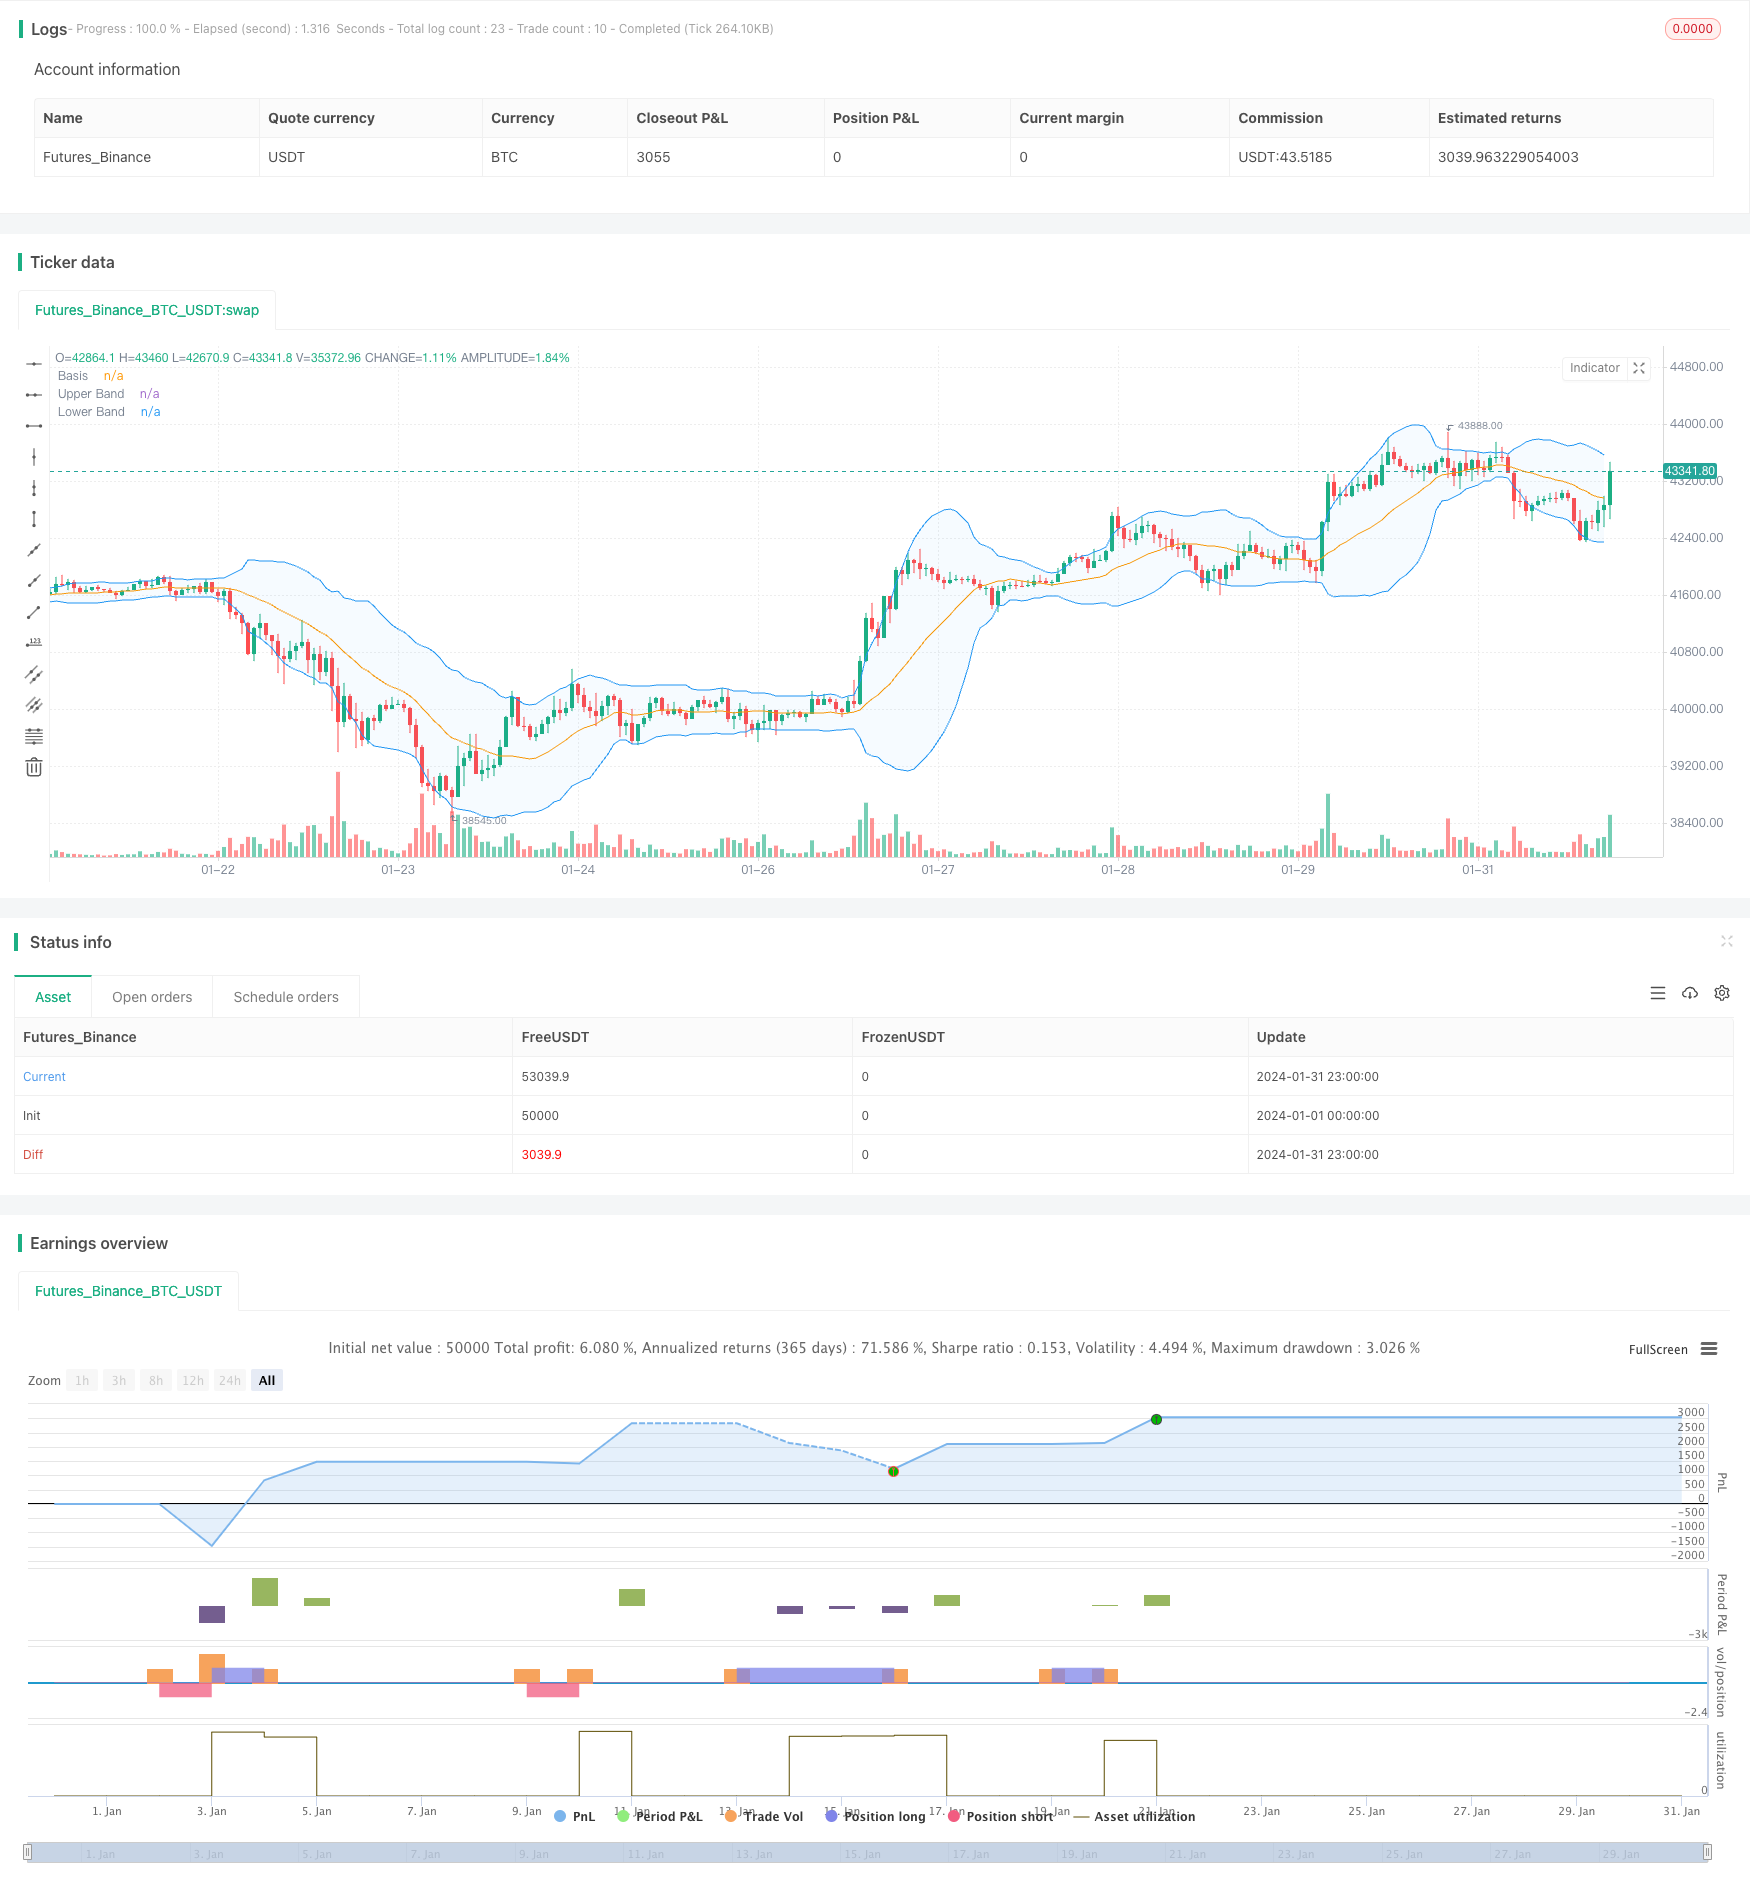
Strategi ini menghasilkan sinyal perdagangan dengan menggunakan kombinasi indikator Brin’s Belt dan indikator RSI yang relatif kuat. Ini memonitor apakah harga penutupan tiga garis K secara bersamaan terjatuh ke atas atau ke bawah, dan menggabungkan indikator gear dan RSI untuk mengkonfirmasi sinyal perdagangan.
Prinsip Strategi
Strategi ini didasarkan pada prinsip-prinsip berikut:
- Menggunakan pita Brin dengan panjang 20 untuk mempertimbangkan sinyal perdagangan ketika harga mendekati batas atas atau bawah
- Meminta harga penutupan tiga garis K untuk terobosan pada saat yang sama, untuk menghindari terobosan palsu
- Kombinasi dengan indikator gear, VIP > 1.25 saat overbought kuat, VIM > 1.25 saat oversold kuat, sinyal filter
- Dengan menggunakan indikator RSI untuk menilai apakah ada overbought atau oversold, RSI di atas 70 dianggap shorting, di bawah RSI di bawah 30 dianggap overbought
- Ketika kondisi di atas terpenuhi, menghasilkan sinyal over atau under
Analisis Keunggulan
Strategi ini memiliki beberapa keuntungan utama:
- Triple BB bands memfilter penembusan palsu, memastikan keandalan penembusan
- Indikator Gearing menilai kekuatan pasar, menghindari perdagangan yang merugikan
- Indeks RSI menilai zona overbought dan oversold, digabungkan dengan indikator Bollinger Bands untuk masuk
- Kombinasi berbagai indikator, penilaian menyeluruh terhadap situasi pasar, sinyal yang lebih tinggi
Analisis risiko
Strategi ini juga memiliki beberapa risiko:
- Indikator pita Brin sangat sensitif terhadap parameter yang memerlukan pengoptimalan panjang dan StdDev
- Indeks turbo juga lebih sensitif terhadap parameter siklus dan perlu disesuaikan dengan pasar yang berbeda.
- Indeks RSI mudah menyimpang dan mungkin kehilangan tren
- Jika ada perbedaan dalam tiga kriteria, Anda tidak akan masuk dan akan kehilangan beberapa kesempatan.
Langkah-langkah pengendalian risiko meliputi:
- Parameter optimasi, parameter dengan tingkat kemenangan tertinggi
- Kombinasi dengan indikator lain, seperti filter volume transaksi
- Loloskan logika penilaian indikator dengan tepat untuk mencegah kehilangan peluang
Arah optimasi
Strategi ini dapat dioptimalkan dalam beberapa hal:
- Optimalkan panjang dan StdDev kalibrasi indikator Brin untuk menemukan parameter optimal
- Optimalkan siklus indikator gearbox agar lebih sesuai dengan pasar yang berbeda
- Menambahkan penilaian indikator lain, seperti volume transaksi, macd, dan lain-lain, untuk memperkaya sinyal diversifikasi
- Menyesuaikan logika penilaian indikator untuk mencegah ketidakcocokan indikator yang menyebabkan ketidakmampuan masuk
- Menambahkan strategi stop loss untuk mengendalikan kerugian maksimum dalam satu transaksi
Meringkaskan
Strategi ini menggunakan berbagai indikator untuk menilai secara komprehensif, dan pada saat yang sama memastikan keandalan sinyal, ada beberapa masalah. Dengan cara seperti pengoptimalan parameter, pengayaan sumber sinyal, penyesuaian logika penilaian, dan stop loss, stabilitas dan profitabilitas strategi dapat ditingkatkan lebih lanjut. Ini memberikan ide yang bagus untuk perdagangan kuantitatif.
/*backtest
start: 2024-01-01 00:00:00
end: 2024-01-31 23:59:59
period: 1h
basePeriod: 15m
exchanges: [{"eid":"Futures_Binance","currency":"BTC_USDT"}]
*/

// This Pine Script™ code is subject to the terms of the Mozilla Public License 2.0 at https://mozilla.org/MPL/2.0/
// © Noway0utstorm

//@version=5
strategy(title='RSI + BB  over 3 bar+--- vortex0.71.3  ', shorttitle='NoWaytruongphuthinh', format=format.price, precision=4,overlay = true)

length = input(20, title="Length")
mult = input(2.0, title="Multiplier")
source = close

basis = ta.sma(source, length)
dev = mult * ta.stdev(source, length)

upperBand = basis + dev
lowerBand = basis - dev

isClosedBar = ta.change(time("15"))

var bool closeAboveUpperBand = false
var bool closeBelowLowerBand = false


// Vortex Indicator Settings
period_ = input.int(14, title='Period', minval=2)

VMP = math.sum(math.abs(high - low[1]), period_)
VMM = math.sum(math.abs(low - high[1]), period_)
STR = math.sum(ta.atr(1), period_)
VIP = VMP / STR
VIM = VMM / STR

//
lengthrsi = input(14, title="RSI Length")
overboughtLevel = input(70, title="Overbought Level")
oversoldLevel = input(30, title="Oversold Level")

sourcersi = close
rsiValue = ta.rsi(sourcersi, lengthrsi)

shouldShort = rsiValue > overboughtLevel
shouldLong = rsiValue < oversoldLevel


if bool(isClosedBar[1]) and bool(isClosedBar[2]) and bool(isClosedBar[3])

    if close[1] > upperBand[1] and close[2] > upperBand[2] and close[3] > upperBand[3] and VIP > 1.25 and VIM < 0.7 and rsiValue > overboughtLevel
        strategy.entry("Short", strategy.short)
        closeAboveUpperBand := false  // Reset the condition when entering a new Short position
    if close[1] < lowerBand[1] and close[2] < lowerBand[2] and close[3] < lowerBand[3] and VIP < 0.7 and VIM > 1.25 and rsiValue < oversoldLevel
        strategy.entry("Long", strategy.long)
        closeBelowLowerBand := false  // Reset the condition when entering a new Long position


if strategy.position_size > 0  // Check if there is an open Long position
    closeAboveUpperBand := close > upperBand  // Update the condition based on close price
    if closeAboveUpperBand
        strategy.close("Long",disable_alert=true)  // Close the Long position if close price is above upper band

if strategy.position_size < 0  // Check if there is an open Short position
    closeBelowLowerBand := close < lowerBand  // Update the condition based on close price
    if closeBelowLowerBand
        strategy.close("Short",disable_alert=true)  // Close the Short position if close price is below lower band

// Plots
plot(basis, color=color.orange, title="Basis")
p1 = plot(upperBand, color=color.blue, title="Upper Band")
p2 = plot(lowerBand, color=color.blue, title="Lower Band")
fill(p1, p2, title = "Background", color=color.rgb(33, 150, 243, 95))