Pola bullish strategi RSI dan RSI yang dihaluskan
Ringkasan
Strategi ini mencari peluang untuk membeli di titik rendah harga dengan menggabungkan indikator RSI dengan indikator RSI yang merata. Ketika indikator RSI berinovasi rendah dan harga tidak berinovasi rendah, dianggap sebagai sinyal multi-headed.
Prinsip Strategi
- Perhitungan RSI dengan parameter 14th line
- Perhitungan RSI yang merata dengan menggunakan rata-rata WMA ganda.
- Jika RSI berada di bawah 30, berarti oversold.
- RSI yang lebih rendah dari 35 adalah lebih berat.
- Untuk menentukan apakah RSI berada di bawah 25.
- Perhitungan RSI berspesialisasi, yaitu mencari RSI yang berinovasi rendah dan harga yang tidak berinovasi rendah.
- Untuk menghitung siklus penurunan RSI yang halus, dibutuhkan 3 hari.
- Ketika semua kondisi di atas terpenuhi, sinyal beli dihasilkan.
- Tetapkan Stop Loss dan Stop Stop Condition.
Strategi ini terutama bergantung pada sifat berbalik dari indikator RSI, yang dikombinasikan dengan trend penilaian RSI yang merata, untuk membeli ketika RSI oversold saat harga berada di bawah tekanan.
Analisis Keunggulan Strategi
- Kombinasi indikator RSI ganda untuk meningkatkan efektivitas strategi.
- Menggunakan fitur reversal dari RSI, ada beberapa keuntungan probabilitas.
- RSI yang merata dapat membantu menghindari pembalikan palsu.
- Logika stop loss yang lengkap dapat membatasi risiko.
Analisis risiko
- Kemungkinan RSI terbalik tidak dapat dihindari sepenuhnya.
- Indeks RSI yang merata terlambat, mungkin melewatkan momen terbaik untuk membeli.
- Stop loss diatur terlalu longgar, risiko kerugian meningkat.
Hal ini dapat dilakukan dengan menyesuaikan parameter RSI, mengoptimalkan waktu pembelian. Mempersingkat interval stop loss dengan tepat, mempercepat stop loss.
Arah optimasi
- Dapat menguji efek dari indikator RSI dengan parameter yang berbeda.
- Mengoptimalkan metode perhitungan RSI smoothing untuk meningkatkan kualitas smoothing.
- Mengatur Stop Loss untuk mencari RR optimal.
- Peningkatan kemampuan penilaian, misalnya, untuk menghindari kekurangan kapasitas.
Dengan penyesuaian parameter dan kombinasi lebih banyak indikator, strategi perdagangan dapat ditingkatkan lebih lanjut.
Meringkaskan
Keseluruhan strategi ini adalah strategi yang memanfaatkan karakteristik RSI yang berbalik. Kombinasi indikator RSI ganda memberikan efek penuh pada efek reversal RSI, tetapi juga meningkatkan ketidakpastian yang disebabkan oleh perbedaan indikator. Keseluruhan adalah strategi strategi indikator yang khas.
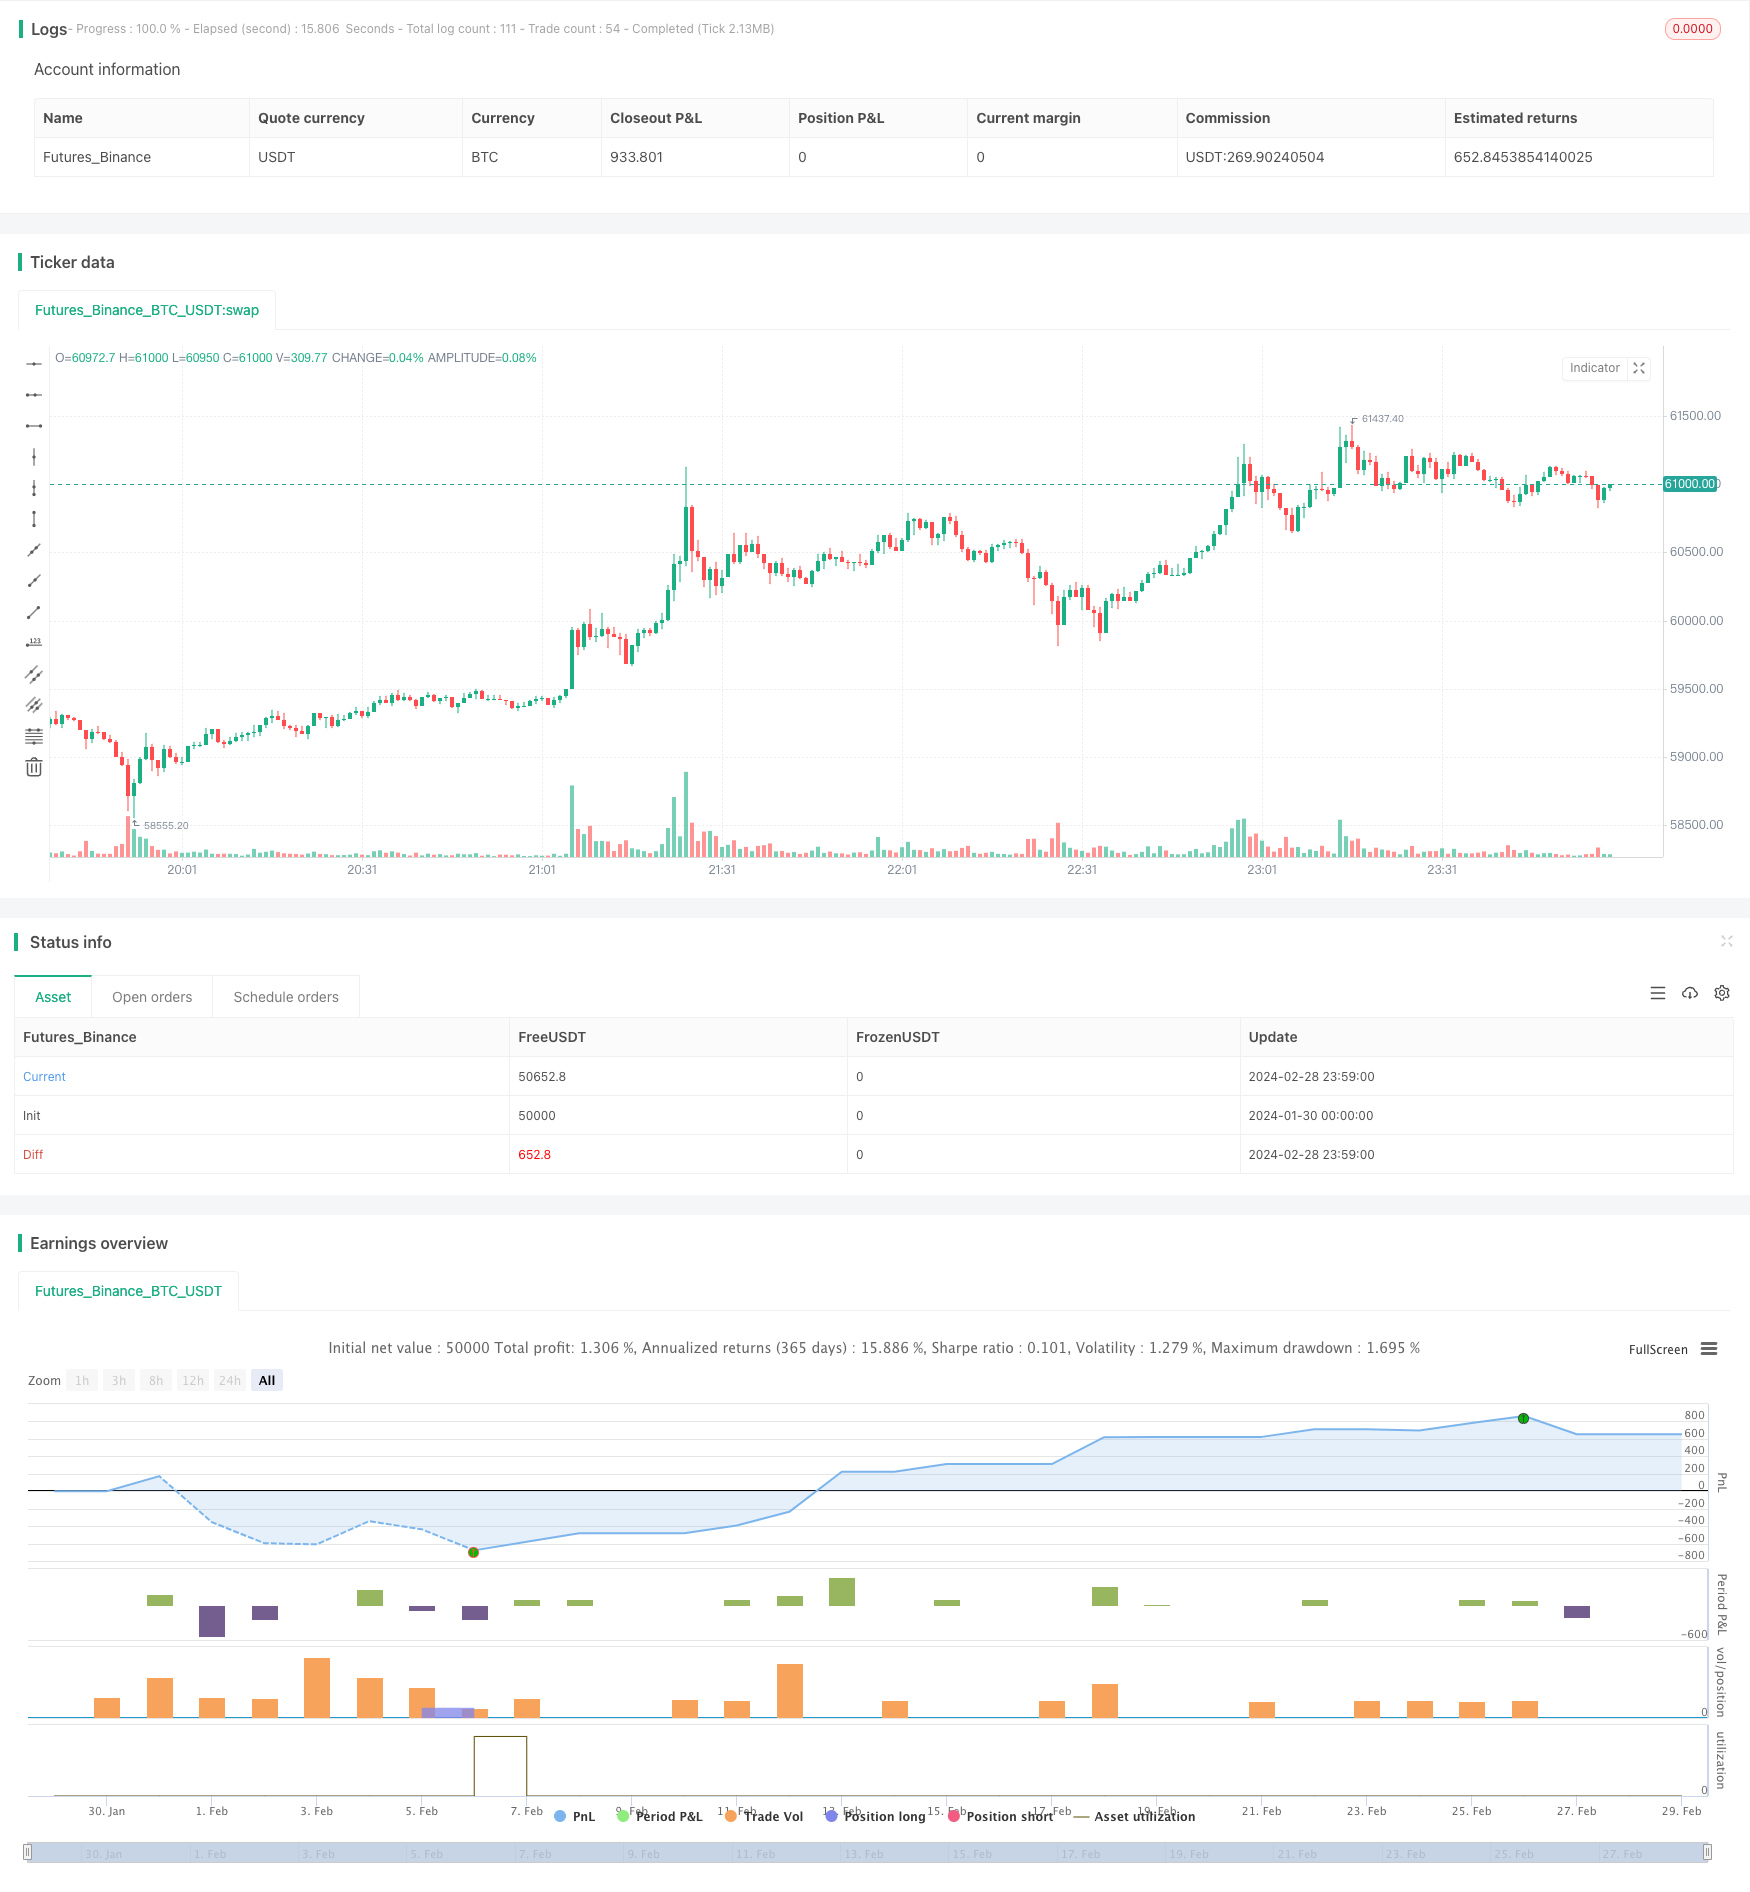
/*backtest
start: 2024-01-30 00:00:00
end: 2024-02-29 00:00:00
period: 1m
basePeriod: 1m
exchanges: [{"eid":"Futures_Binance","currency":"BTC_USDT"}]
*/

// This source code is subject to the terms of the Mozilla Public License 2.0 at https://mozilla.org/MPL/2.0/
// © BigBitsIO

//@version=4
strategy(title="RSI and Smoothed RSI Bull Div Strategy [BigBitsIO]", shorttitle="RSI and Smoothed RSI Bull Div Strategy [BigBitsIO]", overlay=true, pyramiding=1, default_qty_type=strategy.percent_of_equity, default_qty_value=100, commission_type=strategy.commission.percent, commission_value=.1, slippage=0)


TakeProfitPercent = input(3, title="Take Profit %", type=input.float, step=.25)
StopLossPercent = input(1.75, title="Stop Loss %", type=input.float, step=.25)

RSICurve = input(14, title="RSI Lookback Period", type=input.integer, step=1)
BuyBelowTargetPercent = input(0, title="Buy Below Lowest Low In RSI Divergence Lookback Target %", type=input.float, step=.05)
BuyBelowTargetSource = input(close, title="Source of Buy Below Target Price", type=input.source)
SRSICurve = input(10, title="Smoothed RSI Lookback Period", type=input.integer, step=1)
RSICurrentlyBelow = input(30, title="RSI Currently Below", type=input.integer, step=1)
RSIDivergenceLookback = input(25, title="RSI Divergence Lookback Period", type=input.integer, step=1)
RSILowestInDivergenceLookbackCurrentlyBelow  = input(25, title="RSI Lowest In Divergence Lookback Currently Below", type=input.integer, step=1)
RSISellAbove = input(65, title="RSI Sell Above", type=input.integer, step=1)
MinimumSRSIDownTrend = input(3, title="Minimum SRSI Downtrend Length", type=input.integer, step=1)
SRSICurrentlyBelow = input(35, title="Smoothed RSI Currently Below", type=input.integer, step=1)

PlotTarget = input(false, title="Plot Target")


RSI = rsi(close, RSICurve)
SRSI = wma(2*wma(RSI, SRSICurve/2)-wma(RSI, SRSICurve), round(sqrt(SRSICurve))) // Hull moving average

SRSITrendDownLength = 0
if (SRSI < SRSI[1])
    SRSITrendDownLength := SRSITrendDownLength[1] + 1

// Strategy Specific
ProfitTarget = (close * (TakeProfitPercent / 100)) / syminfo.mintick
LossTarget = (close * (StopLossPercent / 100)) / syminfo.mintick
BuyBelowTarget = BuyBelowTargetSource[(lowestbars(RSI, RSIDivergenceLookback)*-1)] - (BuyBelowTargetSource[(lowestbars(RSI, RSIDivergenceLookback)*-1)] * (BuyBelowTargetPercent / 100))

plot(PlotTarget ? BuyBelowTarget : na)


bool IsABuy = RSI < RSICurrentlyBelow and SRSI < SRSICurrentlyBelow and lowest(SRSI, RSIDivergenceLookback) < RSILowestInDivergenceLookbackCurrentlyBelow and BuyBelowTargetSource < BuyBelowTarget and SRSITrendDownLength >= MinimumSRSIDownTrend and RSI > lowest(RSI, RSIDivergenceLookback)
bool IsASell = RSI > RSISellAbove

if IsABuy
    strategy.entry("Positive Trend", true) // buy by market
    strategy.exit("Take Profit or Stop Loss", "Positive Trend", profit = ProfitTarget, loss = LossTarget)
if IsASell
    strategy.close("Positive Trend")