Strategi perdagangan tren multi-kerangka waktu berdasarkan MACD, ADX, dan EMA200

Ringkasan
Strategi ini didasarkan pada indikator MACD, ADX dan EMA200 untuk melakukan perdagangan tren dalam beberapa kerangka waktu dengan menilai tren dan momentum pasar saat ini. Gagasan utama strategi ini adalah menggunakan indikator MACD untuk menilai tren pasar, indikator ADX untuk mengkonfirmasi kekuatan tren, EMA200 sebagai kondisi penyaringan tren, sementara melakukan perdagangan dengan beberapa kerangka waktu untuk mendapatkan lebih banyak peluang perdagangan dan rasio risiko keuntungan yang lebih baik.
Prinsip Strategi
- Menghitung Indeks Moving Average 200 Hari (EMA200) sebagai kondisi penyaringan tren.
- Menghitung indikator MACD, termasuk garis MACD, garis sinyal, dan grafik pilar, untuk menilai tren pasar.
- Perhitungan real volatility rate (ATR) dan directional movement indicator (ADX) digunakan untuk mengkonfirmasi kekuatan tren.
- Kondisi masuk multi-head: harga close out di atas EMA 200, MACD di atas sinyal dan di bawah 0, ADX lebih besar dari atau sama dengan 25.
- Kondisi masuk kosong: harga penutupan di bawah EMA 200, MACD di bawah garis sinyal dan di atas 0, ADX lebih besar dari 25 <unk>.
- Menggunakan ATR untuk menghitung stop loss dan stop loss distance, set stop loss 1% dan set stop loss 1.5%.
- Bila kondisi multihead terpenuhi, lakukan lebih banyak dengan cara menghentikan satuan dan batas harga satuan; bila kondisi kosong dipenuhi, lakukan kosong dengan cara menghentikan satuan dan batas harga satuan.
- Uji strategi dalam kerangka waktu yang berbeda, seperti 15 menit, 30 menit, 1 jam, dan lain-lain, untuk menemukan kerangka waktu perdagangan yang optimal.
Analisis Keunggulan
- Menggabungkan beberapa indikator untuk membuat keputusan perdagangan dapat membantu meningkatkan keandalan dan stabilitas strategi.
- Dengan menggunakan multi-frame trading, Anda dapat menangkap berbagai tingkat tren dan mendapatkan lebih banyak peluang trading.
- Dengan menggunakan ATR untuk menghitung stop loss dan stop loss distance, posisi dapat disesuaikan secara dinamis untuk mengendalikan risiko.
- Pengaturan stop loss dan stop loss yang masuk akal dapat membantu meningkatkan rasio risiko-keuntungan strategi.
- Struktur kodenya jelas, mudah dipahami dan dioptimalkan.
Analisis risiko
- Strategi ini bergantung pada pasar yang sedang tren, dan mungkin kurang baik dalam pasar yang bergoyang.
- Pengaturan parameter untuk beberapa indikator mungkin perlu dioptimalkan untuk pasar dan aset yang berbeda, yang dapat menyebabkan kinerja strategi yang buruk.
- Pengaturan stop loss dan stop loss tetap dan mungkin tidak dapat beradaptasi dengan perubahan pasar, yang menyebabkan peningkatan kerugian atau penurunan keuntungan.
- Transaksi multi-frame dapat meningkatkan frekuensi transaksi, sehingga meningkatkan biaya transaksi.
Solusi:
- Memperkenalkan optimasi parameter adaptasi, menyesuaikan parameter indikator secara otomatis sesuai dengan perubahan pasar.
- Mengubah stop loss dan stop loss secara dinamis, misalnya dengan menggunakan stop loss tracking atau stop change.
- Mempertimbangkan biaya transaksi dalam pengulangan, memilih jangka waktu yang optimal dan frekuensi transaksi.
Arah optimasi
- Menggunakan indikator lain untuk mengkonfirmasi tren, seperti Brin Belt, Equilibrium System, dan lain-lain, untuk meningkatkan akurasi penilaian tren.
- Optimalkan pengaturan stop loss dan stop loss, misalnya dengan stop loss dinamis atau stop loss berbasis volatilitas.
- Menambahkan lebih banyak filter pada sinyal perdagangan, seperti volume perdagangan, sentimen pasar, dan sebagainya, meningkatkan kualitas sinyal.
- Optimalkan parameter untuk pasar dan aset yang berbeda untuk menemukan kombinasi optimal.
- Pertimbangkan untuk memperkenalkan algoritma pembelajaran mesin, beradaptasi dengan perubahan pasar, meningkatkan fleksibilitas dan stabilitas strategi.
Dengan optimasi ini, strategi dapat meningkatkan robustitas dan profitabilitas, sehingga dapat beradaptasi dengan lebih baik dengan berbagai kondisi pasar.
Meringkaskan
Strategi ini memiliki beberapa keunggulan dan kelayakan dengan menggabungkan indikator seperti MACD, ADX dan EMA200, untuk melakukan perdagangan tren dalam beberapa kerangka waktu. Kunci strategi adalah penilaian tren dan konfirmasi kekuatan tren, dan peluang tren dapat ditangkap dengan lebih baik melalui kerja sama beberapa indikator.
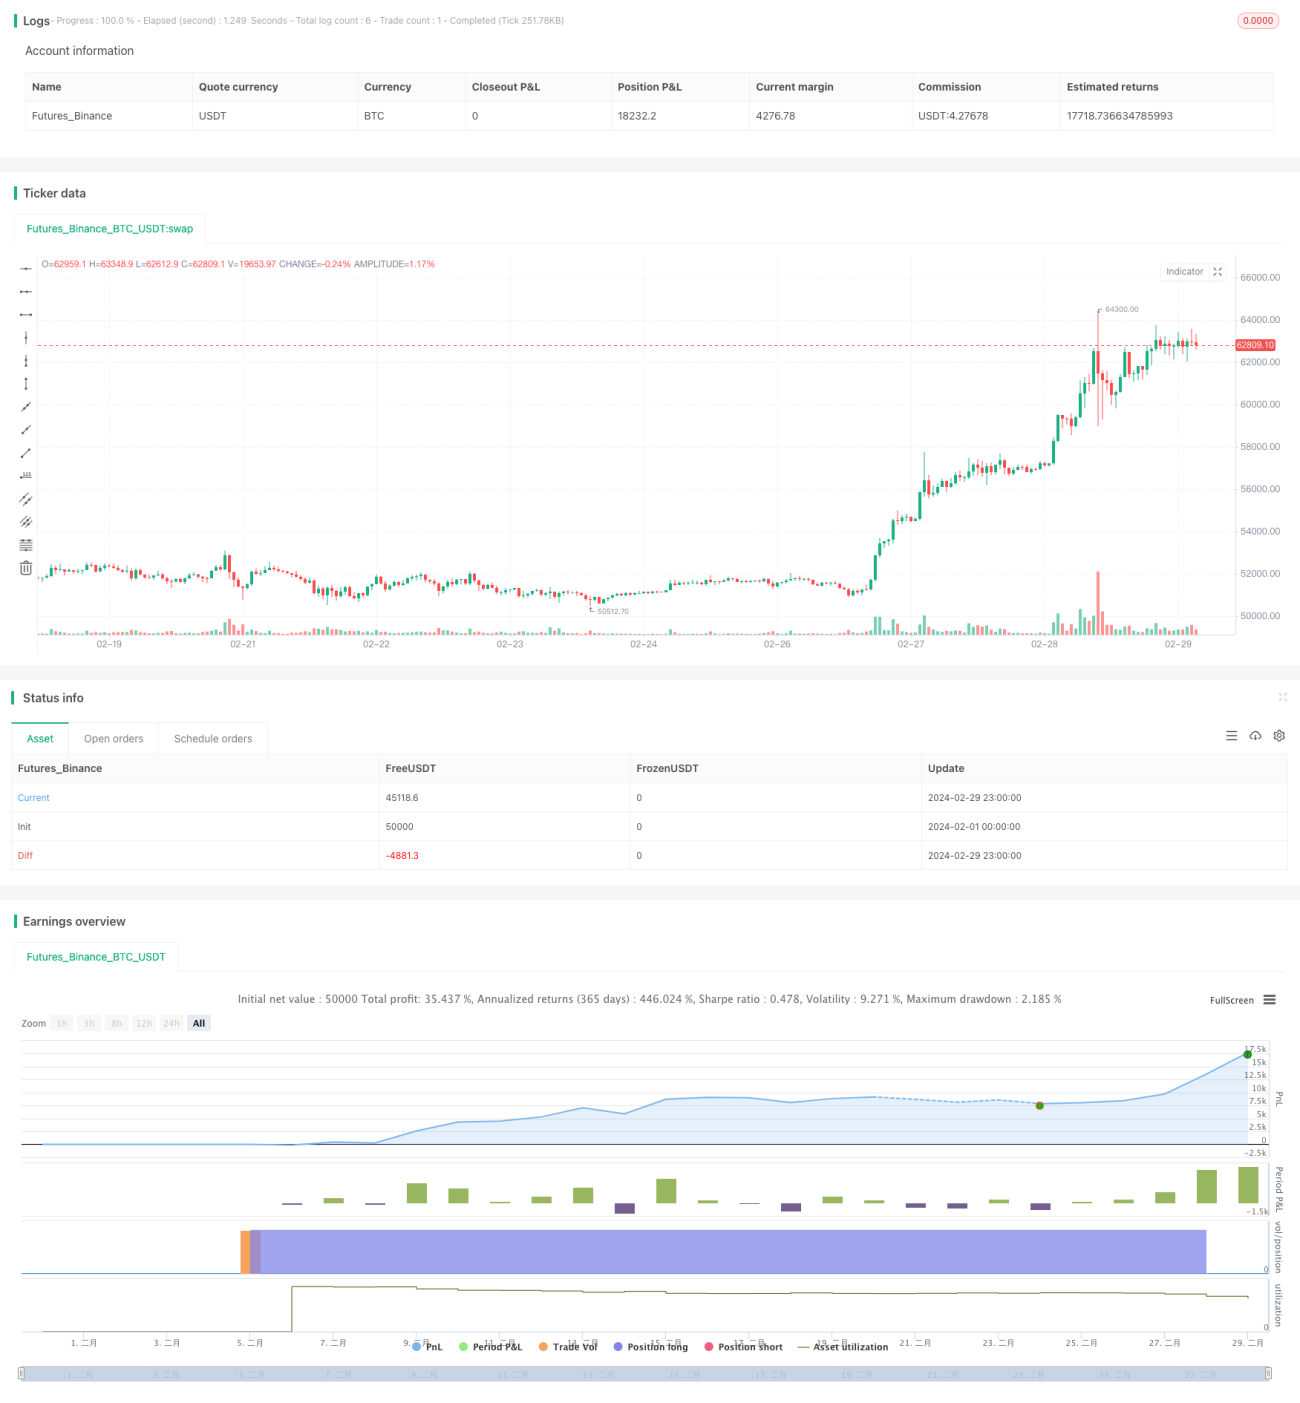
/*backtest
start: 2024-02-01 00:00:00
end: 2024-02-29 23:59:59
period: 1h
basePeriod: 15m
exchanges: [{"eid":"Futures_Binance","currency":"BTC_USDT"}]
*/

// This Pine Script™ code is subject to the terms of the Mozilla Public License 2.0 at https://mozilla.org/MPL/2.0/
// © colemanrumsey

//@version=5- 1