Strategi Perdagangan Kuantitatif Crossover Rata-rata Bergerak Eksponensial

Ringkasan
Strategi ini menggunakan persimpangan dua indeks moving average (EMA) sebagai sinyal jual beli. Ketika EMA periode lebih pendek melintasi EMA periode lebih panjang dari bawah ke atas, menghasilkan sinyal beli; sebaliknya, ketika EMA periode lebih pendek melintasi EMA periode lebih panjang dari atas ke bawah, menghasilkan sinyal jual. Strategi ini juga menilai apakah titik persimpangan adalah harga tertinggi atau terendah dalam 10 siklus perdagangan terakhir, untuk mengkonfirmasi kekuatan tren. Jika titik persimpangan adalah tertinggi, harga akan ditampilkan dalam warna hijau di latar belakang; jika harga terendah, akan ditampilkan dalam warna merah.
Prinsip Strategi
- Hitung EMA dari dua periode yang berbeda, dengan periode default 5 dan 10.
- Jika EMA jangka pendek melintasi EMA jangka panjang dari atas ke bawah, maka akan ada sinyal beli. Jika EMA jangka pendek melintasi EMA jangka panjang dari atas ke bawah, maka akan ada sinyal jual.
- Pada saat menghasilkan sinyal silang, pertimbangkan apakah titik silang saat ini adalah harga tertinggi atau terendah dalam 10 siklus perdagangan terakhir. Jika harga tertinggi, maka dianggap sebagai tren naik yang kuat; Jika harga terendah, maka dianggap sebagai tren turun yang kuat.
- Jika ada sinyal beli dan tidak ada posisi saat ini, maka akan ada overorder. Jika ada sinyal jual dan tidak ada posisi saat ini, maka akan ada overorder kosong.
- Jika sudah ada beberapa opsi yang memegang posisi dan EMA jangka pendek melintasi EMA jangka panjang dari atas ke bawah, maka lebih banyak opsi; jika sudah ada opsi kosong yang memegang posisi dan EMA jangka pendek melintasi EMA jangka panjang dari bawah ke atas, maka kosong.
Keunggulan Strategis
- Indeks bergerak rata-rata lebih cepat bereaksi terhadap perubahan harga dibandingkan dengan rata-rata bergerak sederhana, sehingga dapat menghasilkan sinyal perdagangan yang lebih tepat waktu.
- Dengan menilai apakah titik persimpangan adalah harga tertinggi atau harga terendah dalam beberapa waktu terakhir, peluang perdagangan dengan kekuatan tren yang lebih besar dapat disaring untuk meningkatkan keuntungan strategi.
- Pada grafik, harga titik silang ditandai untuk memberikan referensi perdagangan yang lebih intuitif bagi pedagang.
- Kode logikanya jelas, mudah dipahami dan diterapkan.
Risiko Strategis
- Sinyal yang dihasilkan oleh EMA cross mungkin memiliki keterlambatan, yang menyebabkan kehilangan waktu perdagangan terbaik.
- Dalam pasar yang bergejolak, EMA-crossing dapat terjadi secara sering, menyebabkan terlalu banyak transaksi dan meningkatkan biaya transaksi.
- Strategi ini kurang memiliki langkah-langkah penghentian kerugian, yang dapat menimbulkan risiko lebih besar untuk ditarik kembali jika ada kesalahan penilaian.
Arah optimasi strategi
- Masuknya lebih banyak indikator teknis seperti RSI, MACD, dan lain-lain untuk membantu menentukan kekuatan dan arah tren, meningkatkan akurasi sinyal.
- Tetapkan stop loss dan stop loss yang wajar untuk mengendalikan risiko transaksi tunggal.
- Optimalisasi parameter perdagangan, seperti siklus EMA, jendela waktu konfirmasi silang, dan lain-lain, untuk meningkatkan fleksibilitas strategi.
- Dengan menggunakan indikator sentimen pasar, seperti VIX, sinyal perdagangan disaring untuk mengurangi sinyal yang salah.
- Pertimbangkan untuk menambahkan modul manajemen posisi dan pengelolaan dana, secara dinamis menyesuaikan jumlah dana untuk setiap transaksi, dan meningkatkan efisiensi penggunaan dana.
Meringkaskan
Strategi ini menggunakan crossover rata-rata bergerak indeks sebagai logika inti, sekaligus menggabungkan posisi relatif harga titik persimpangan dalam jangka pendek, untuk menilai kekuatan tren. Secara keseluruhan, logika strategi jelas, keunggulan jelas, tetapi ada juga keterbatasan dan risiko tertentu. Dengan memperkenalkan lebih banyak indikator penilaian tambahan, mengatur langkah-langkah pengendalian risiko yang masuk akal, dan mengoptimalkan parameter kunci, stabilitas dan profitabilitas strategi ini dapat ditingkatkan lebih lanjut.
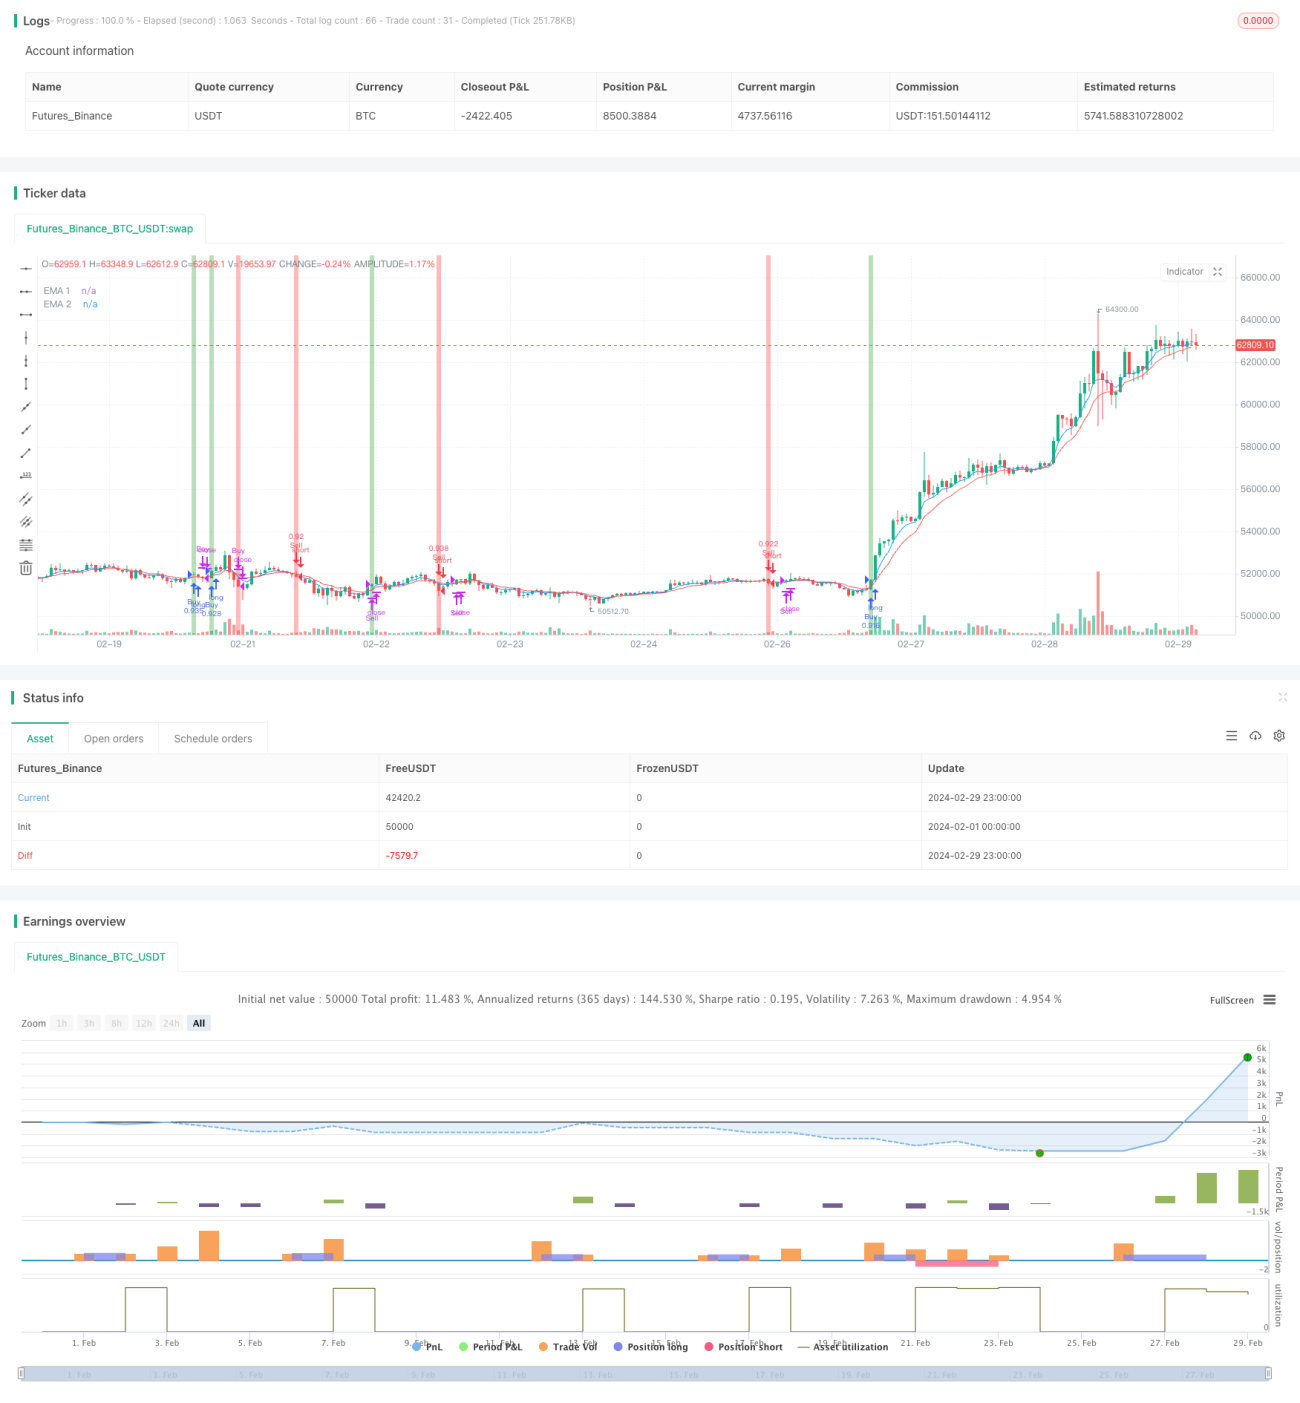
/*backtest
start: 2024-02-01 00:00:00
end: 2024-02-29 23:59:59
period: 1h
basePeriod: 15m
exchanges: [{"eid":"Futures_Binance","currency":"BTC_USDT"}]
*/

// This source code is subject to the terms of the Mozilla Public License 2.0 at https://mozilla.org/MPL/2.0/
// © ZenAndTheArtOfTrading
// @version=5
strategy("ema giao nhau", overlay=true, default_qty_type=strategy.percent_of_equity, default_qty_value=100)- 1