Strategi Mengikuti Tren Indeks Kekuatan Relatif yang Dimodifikasi
Tanggal Pembuatan:
2024-03-29 16:16:37
Akhirnya memodifikasi:
2024-03-29 16:16:37
menyalin:
10
Jumlah klik:
728
1
fokus pada
1750
Pengikut
Ringkasan
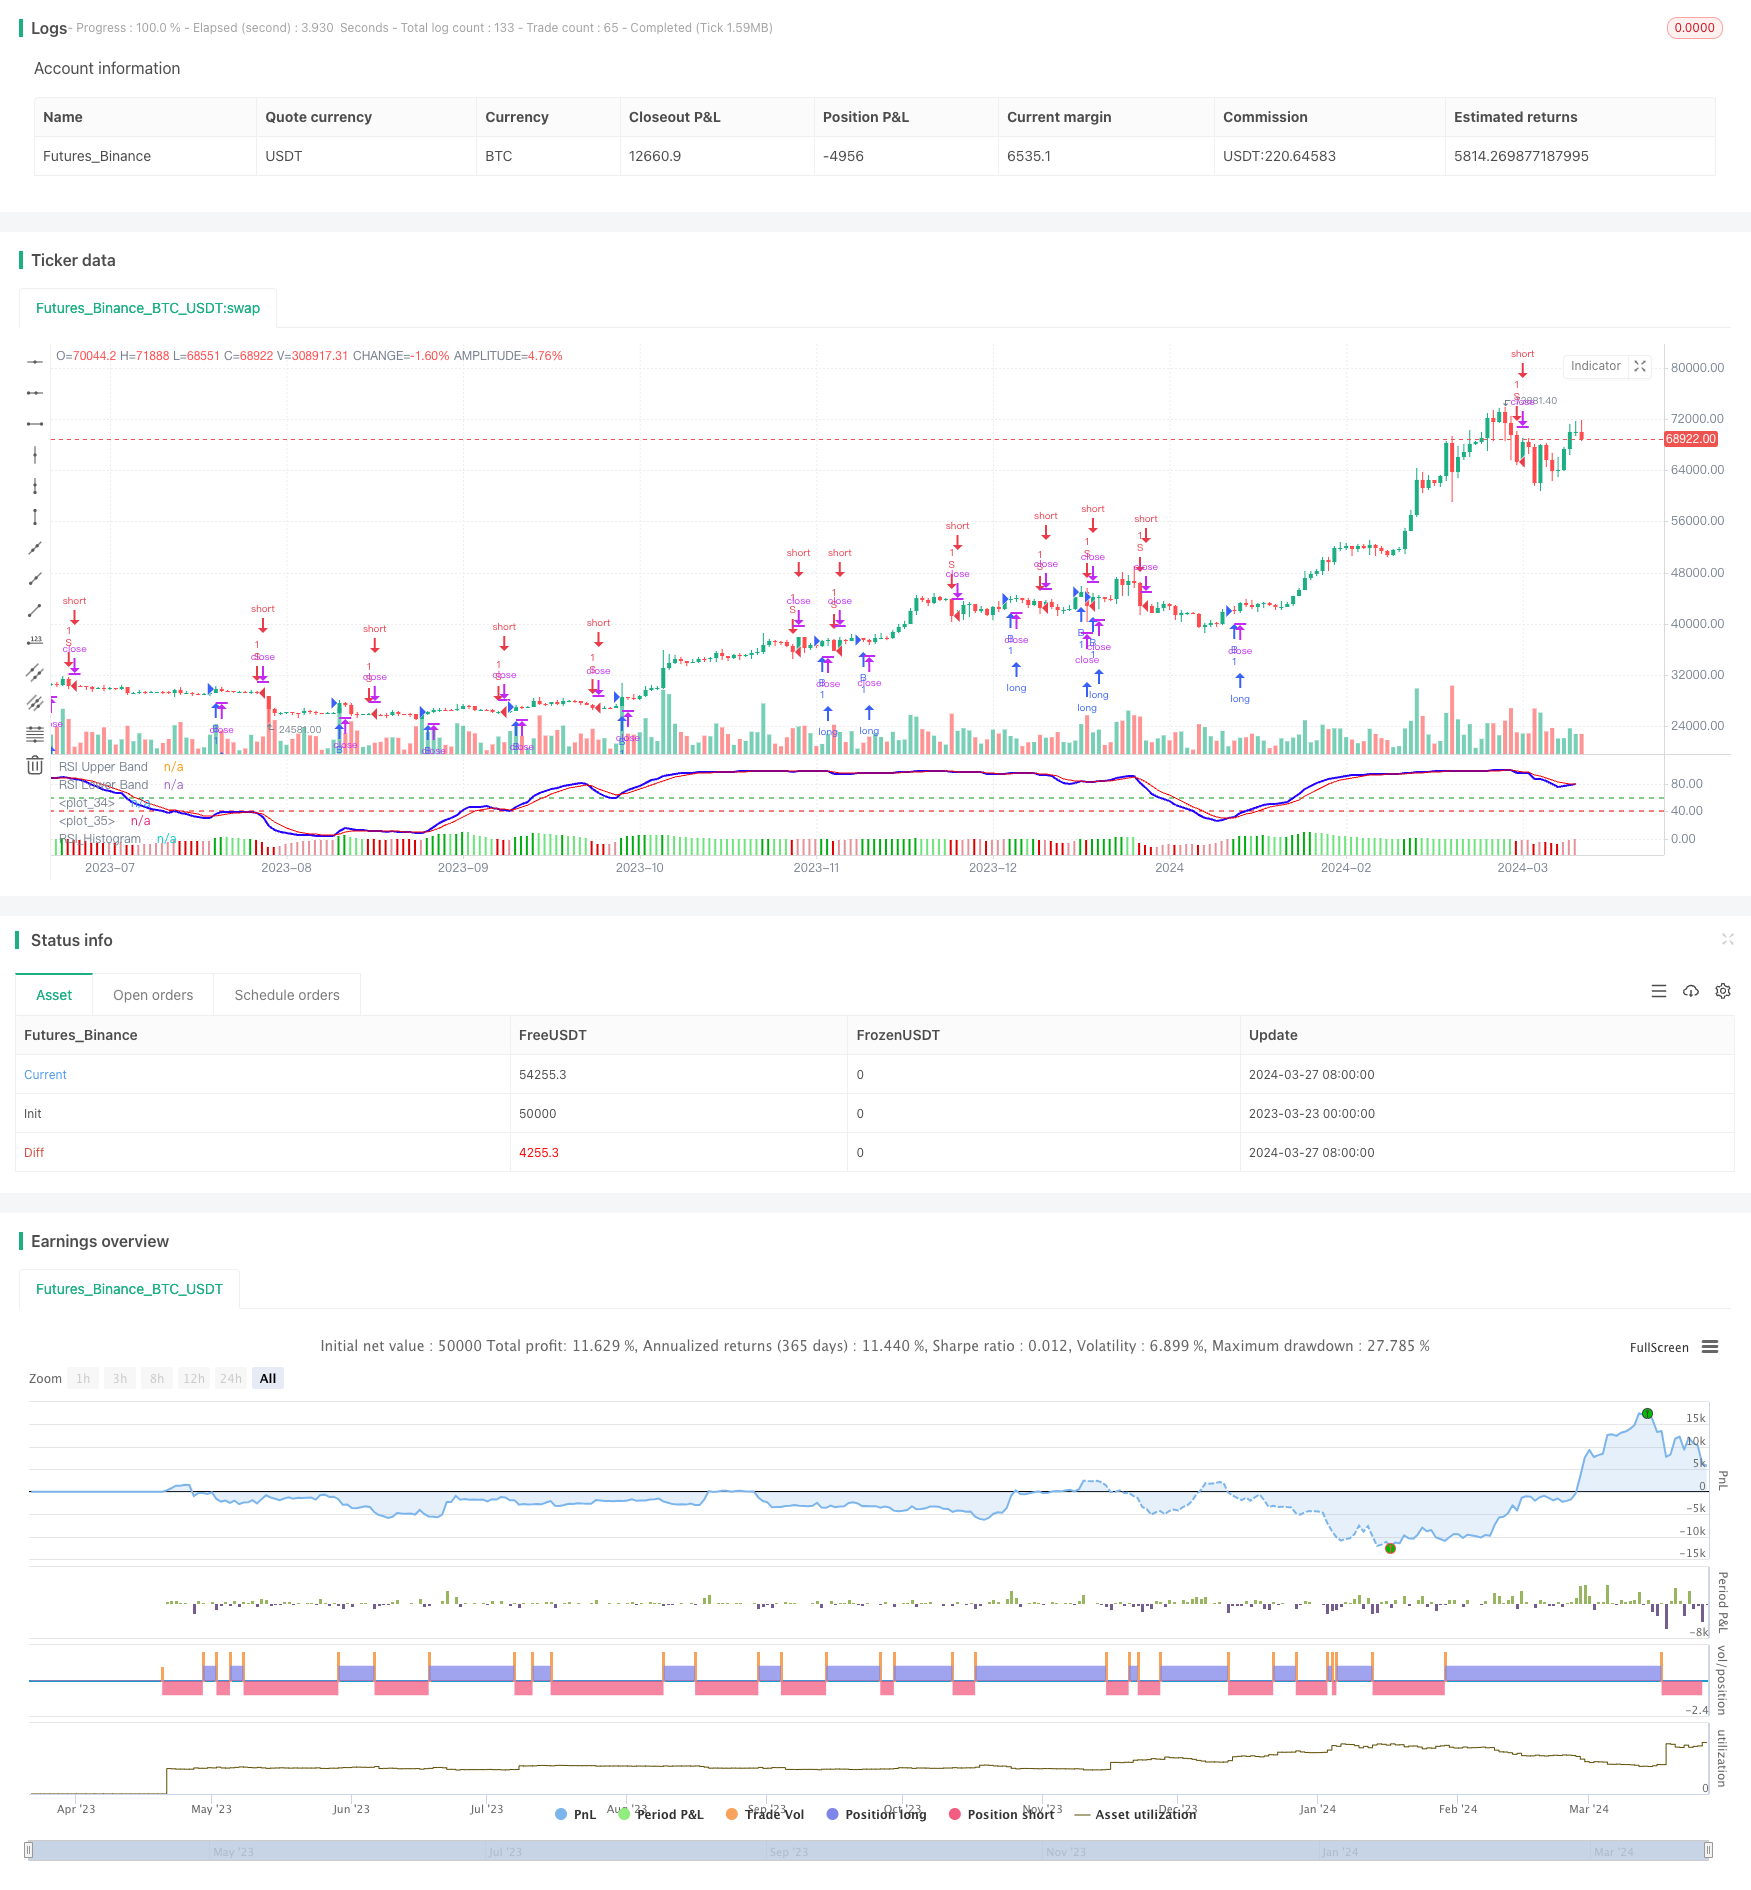
Strategi ini didasarkan pada indeks kekuatan relatif yang dimodifikasi (Modified RSI) untuk menangkap tren pasar. Gagasan utama strategi ini adalah menggunakan sinyal silang dan sinyal grafik lurus dari indikator Modified RSI untuk menilai tren pasar dan melakukan perdagangan sesuai dengan arah tren.
Prinsip Strategi
- Menghitung harga EMA sebagai input Modified RSI
- Perhitungan RSI Modified
- Menghitung EMA dari Modified RSI sebagai garis sinyal
- Hitung perbedaan antara Modified RSI dan garis sinyal sebagai garis lurus
- Ketika Modified RSI melintasi garis sinyal dan garis lurus lebih besar dari 0, menghasilkan sinyal beli
- Ketika Modified RSI melintasi garis sinyal dan garis lurus lebih kecil dari 0, menghasilkan sinyal jual
Keunggulan Strategis
- Modified RSI lebih baik menangkap tren dibandingkan RSI tradisional
- Kombinasi sinyal silang Modified RSI dan sinyal grafik lurus, dapat memfilter sinyal palsu secara efektif
- Parameter dapat disesuaikan untuk pasar dan siklus yang berbeda
- Prosesnya sederhana dan efisien.
Risiko Strategis
- Indikator RSI yang dimodifikasi dapat memberikan sinyal yang salah dalam pasar yang bergejolak
- Penangkapan titik balik tren mungkin terlambat
- Indeks tunggal mudah terganggu oleh kebisingan harga
Arah optimasi strategi
- Dapat dikombinasikan dengan indikator tren lainnya seperti moving averages untuk meningkatkan keandalan sinyal
- Modul Stop Loss Stop Stop dapat ditambahkan untuk mengontrol risiko transaksi tunggal
- Parameter yang dapat dioptimalkan sesuai dengan karakteristik pasar yang berbeda
- Anda dapat bergabung dengan modul manajemen posisi, secara dinamis menyesuaikan posisi
Meringkaskan
Strategi ini memanfaatkan karakteristik indikator Modified RSI untuk membangun sistem perdagangan dari sudut pandang pelacakan tren. Indikator Modified RSI mengatasi beberapa kekurangan indikator RSI tradisional, kemampuan menangkap tren yang relatif kuat. Namun, strategi indikator tunggal sering memiliki keterbatasan dan perlu digabungkan dengan alat teknis lainnya untuk meningkatkan.
Kode Sumber Strategi
/*backtest
start: 2023-03-23 00:00:00
end: 2024-03-28 00:00:00
period: 1d
basePeriod: 1h
exchanges: [{"eid":"Futures_Binance","currency":"BTC_USDT"}]
*/

// This source code is subject to the terms of the Mozilla Public License 2.0 at https://mozilla.org/MPL/2.0/
// © YogirajDange

//@version=5


// Verical lines


// // Define the times
// t1 = timestamp(year, month, dayofmonth, 09, 15) // 9:15
// t2 = timestamp(year, month, dayofmonth, 11, 15) // 11:15
// t3 = timestamp(year, month, dayofmonth, 13, 15) // 1:15
// t4 = timestamp(year, month, dayofmonth, 15, 25) // 3:25

// // Check if the current bar is on the current day
// is_today = (year(time) == year(timenow)) and (month(time) == month(timenow)) and (dayofmonth(time) == dayofmonth(timenow))

// // Draw a vertical line at each time
// if is_today and (time == t1 or time == t2 or time == t3 or time == t4)
//     line.new(x1 = bar_index, y1 = low, x2 = bar_index, y2 = high, extend = extend.both, color=color.red, width = 1)

strategy('Modified RSI')
col_grow_above = input(#02ac11, "Above   Grow", group="Histogram", inline="Above")
col_fall_above = input(#6ee47d, "Fall", group="Histogram", inline="Above")
col_grow_below = input(#e5939b, "Below Grow", group="Histogram", inline="Below")
col_fall_below = input(#dd0000, "Fall", group="Histogram", inline="Below")
EMA_length = input.int(13, 'Price_EMA', minval=1)
RSI_length = input.int(14, 'RSI_Period', minval=1)
Avg_length = input.int(5, 'RSI_Avg_EMA', minval=1)
fastMA = ta.ema(close, EMA_length)
modrsi = ta.rsi(fastMA, RSI_length)
RSIAVG = ta.ema(modrsi, Avg_length)
plot(modrsi, color=color.rgb(38, 0, 255), linewidth=2)
plot(RSIAVG, color=color.rgb(247, 0, 0))
rsiUpperBand = hline(60, 'RSI Upper Band', color=#099b0e)
//hline(50, "RSI Middle Band", color=color.new(#787B86, 50))
rsiLowerBand = hline(40, 'RSI Lower Band', color=#e90101)

RSI_hist = modrsi - RSIAVG

//plot(RSI_hist,"RSI_Histogram", color = #c201e9, style = plot.style_columns,linewidth= 5)

plot(RSI_hist, title="RSI_Histogram", style=plot.style_columns, color=(RSI_hist>=0 ? (RSI_hist[1] < RSI_hist ? col_grow_above : col_fall_above) : (RSI_hist[1] < RSI_hist ? col_grow_below : col_fall_below)))


/////// Moving Averages 20 50 EMA

fast_ma = input.int(20, minval=2, title="Fast_EMA")
slow_ma = input.int(50, minval=2, title="Slow_EMA")

src = input.source(close, title="Source")

out = ta.ema(src, fast_ma)
out1 = ta.ema(src, slow_ma)

//plot(out, title="20 EMA", color=color.rgb(117, 71, 247), linewidth = 2)
//plot(out1, title="50 EMA", color=color.rgb(0, 0, 0), linewidth = 2)


longCondition = ((ta.crossover(modrsi, RSIAVG)) and (RSI_hist > 0))
if longCondition
    strategy.entry('B', strategy.long)

shortCondition = ((ta.crossunder(modrsi, RSIAVG)) and (RSI_hist < 0))
if shortCondition
    strategy.entry('S', strategy.short)