Strategi Perdagangan Momentum Filter Interval Ganda
Ringkasan
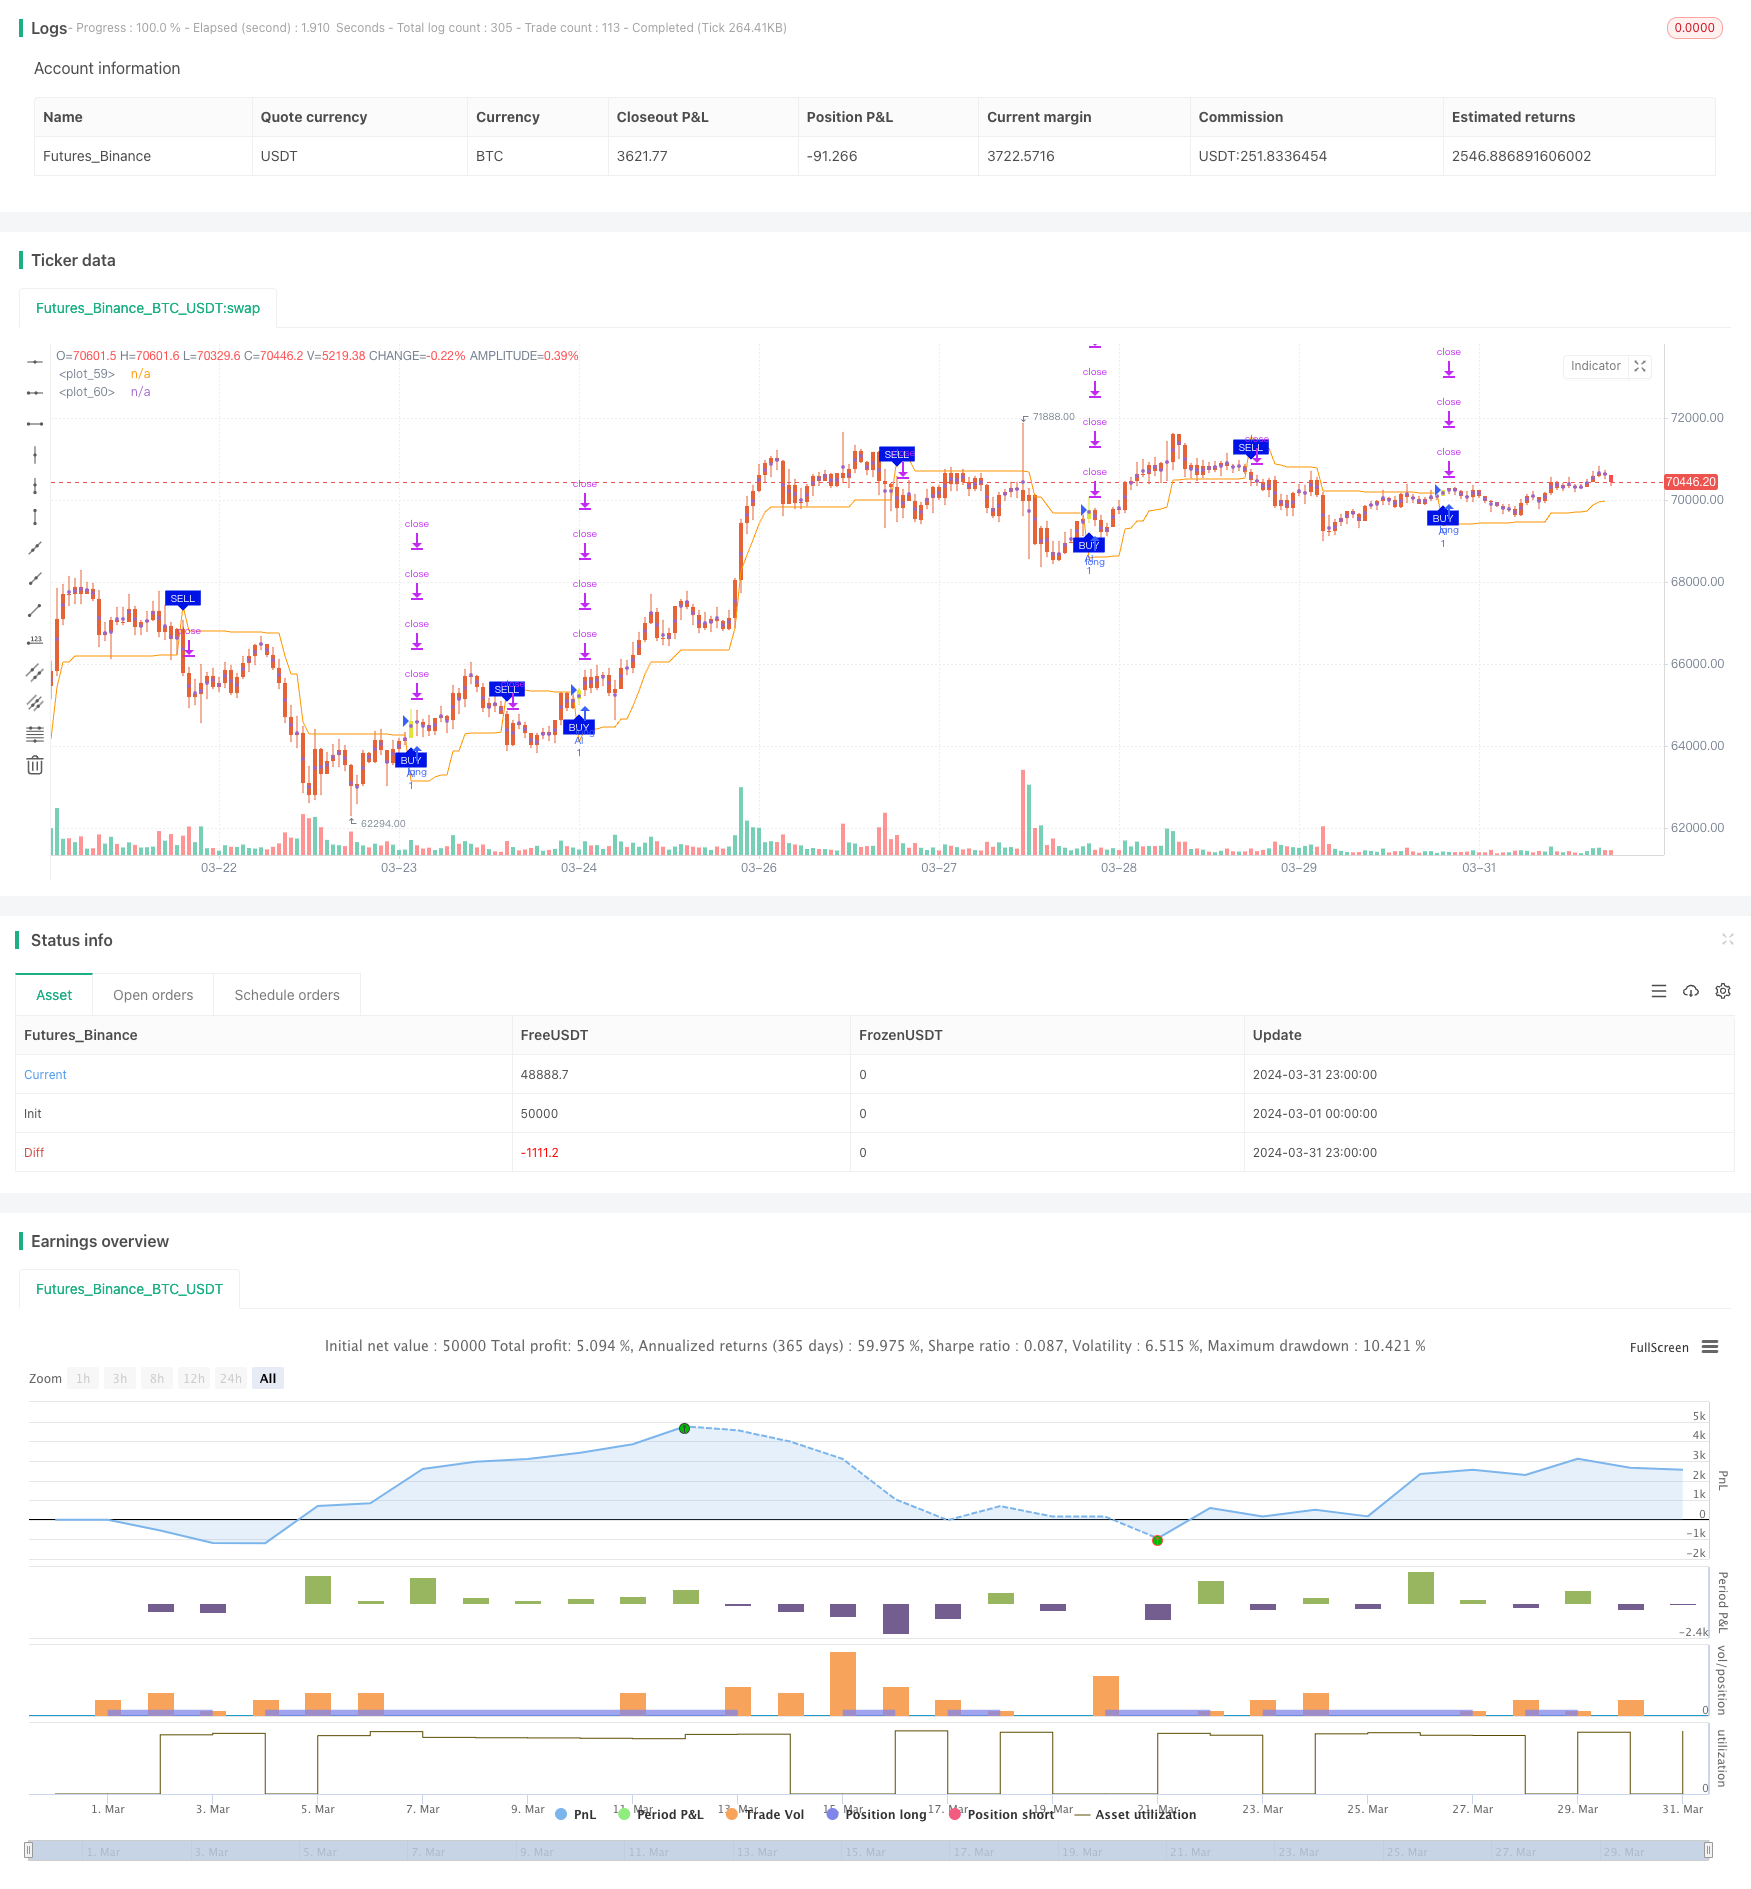
Strategi ini adalah strategi perdagangan dinamis berdasarkan filter dua interval. Strategi ini menghasilkan filter interval komprehensif yang digunakan untuk menilai pergerakan harga saat ini dengan menghitung interval perataan dua siklus cepat dan lambat. Strategi ini menghasilkan sinyal beli / jual ketika harga melewati / turun melalui interval tersebut.
Prinsip Strategi
- Hitung jarak rata antara dua periode cepat dan lambat. Jarak cepat menggunakan periode yang lebih pendek dan perkalian yang lebih kecil, dan jarak lambat menggunakan periode yang lebih lama dan perkalian yang lebih besar.
- Menggunakan rata-rata dari jarak cepat dan lambat sebagai filter jarak komprehensif ((TRF) }}.
- Menghitung hubungan antara harga saat ini dengan harga sebelumnya untuk menentukan tren naik (upward) dan tren turun (downward).
- Perhitungan dinamika atas (FUB) dan bawah (FLB) sebagai referensi tren.
- Pada saat ini, ada beberapa indikator yang dapat digunakan untuk menentukan harga.
- Siapkan empat stop-loss dan satu stop-loss gradien, sesuai dengan rasio posisi yang berbeda dan persentase keuntungan / kerugian.
Analisis Keunggulan
- Filter dual-band yang menggabungkan siklus cepat dan lambat, mampu beradaptasi dengan berbagai irama pasar, menangkap lebih banyak peluang perdagangan.
- Desain yang dinamis di atas dan di bawah rel membantu mengikuti tren saat ini dan mengurangi sinyal palsu.
- Pengaturan empat stop-gradient memungkinkan Anda untuk mendapatkan lebih banyak keuntungan jika tren berlanjut, dan juga dapat mengunci sebagian keuntungan tepat waktu jika tren berbalik.
- Pengaturan stop loss membantu mengendalikan kerugian maksimum dalam satu transaksi dan melindungi keamanan akun.
Analisis risiko
- Strategi ini dapat menghasilkan lebih banyak sinyal palsu ketika pasar bergejolak atau bergejolak, yang menyebabkan kehilangan transaksi dan biaya yang sering terjadi.
- Pengaturan stop-gradient dapat menyebabkan sebagian keuntungan terkunci lebih awal dan tidak dapat sepenuhnya menikmati keuntungan dari tren.
- Pengaturan anti-kerusakan mungkin tidak dapat sepenuhnya menghindari kerugian ekstrim yang ditimbulkan oleh Black Swan.
Arah optimasi
- Anda dapat mempertimbangkan untuk memperkenalkan lebih banyak indikator teknis atau indikator sentimen pasar sebagai tambahan untuk menilai tren dan mengurangi sinyal palsu.
- Pengaturan untuk stop loss dan stop loss dapat disesuaikan secara dinamis sesuai dengan kondisi pasar yang berbeda dan varietas perdagangan, meningkatkan fleksibilitas strategi.
- Berdasarkan pengukuran ulang, pengaturan parameter dapat dioptimalkan lebih lanjut, seperti pemilihan siklus antara kecepatan cepat dan lambat, pengaturan persentase stop loss dan stop loss, dan sebagainya, untuk meningkatkan stabilitas dan profitabilitas strategi.
Meringkaskan
Strategi perdagangan berskala ganda berskala ganda berskala ganda dengan membangun filter komprehensif melalui zona peredaman dua siklus yang cepat dan lambat, sekaligus menggabungkan dinamika naik dan turun, menilai pergerakan harga, menghasilkan sinyal jual beli. Strategi ini juga menyiapkan empat stop-loss dan stop-loss untuk mengendalikan risiko dan mengunci keuntungan. Strategi ini cocok untuk digunakan dalam situasi tren, tetapi mungkin akan menghasilkan lebih banyak sinyal palsu di pasar yang bergolak.
/*backtest
start: 2024-03-01 00:00:00
end: 2024-03-31 23:59:59
period: 1h
basePeriod: 15m
exchanges: [{"eid":"Futures_Binance","currency":"BTC_USDT"}]
*/

// This source code is subject to the terms of the Mozilla Public License 2.0 at https://mozilla.org/MPL/2.0/
//@version=5
strategy(title='2"Twin Range Filter', overlay=true)
strat_dir_input = input.string(title='İşlem Yönü', defval='Alis', options=['Alis', 'Satis', 'Tum'])
strat_dir_value = strat_dir_input == 'Alis' ? strategy.direction.long : strat_dir_input == 'Satis' ? strategy.direction.short : strategy.direction.all
strategy.risk.allow_entry_in(strat_dir_value)

////////////////////////////

// Backtest inputs
BaslangicAy = input.int(defval=1, title='İlk ay', minval=1, maxval=12)
BaslangicGun = input.int(defval=1, title='İlk Gün', minval=1, maxval=31)
BaslangicYil = input.int(defval=2023, title='İlk Yil', minval=2000)
SonAy = input.int(defval=1, title='Son Ay', minval=1, maxval=12)
SonGun = input.int(defval=1, title='Son Gün', minval=1, maxval=31)
SonYil = input.int(defval=9999, title='Son Yıl', minval=2000)

start = timestamp(BaslangicYil, BaslangicAy, BaslangicGun, 00, 00)  // backtest start window
finish = timestamp(SonYil, SonAy, SonGun, 23, 59)  // backtest finish window
window() => true

source = input(defval=close, title='Source')
showsignals = input(title='Show Buy/Sell Signals ?', defval=true)
per1 = input.int(defval=27, minval=1, title='Fast period')
mult1 = input.float(defval=1.6, minval=0.1, title='Fast range')
per2 = input.int(defval=55, minval=1, title='Slow period')
mult2 = input.float(defval=2, minval=0.1, title='Slow range')
smoothrng(x, t, m) =>
    wper = t * 2 - 1
    avrng = ta.ema(math.abs(x - x[1]), t)
    smoothrng = ta.ema(avrng, wper) * m
    smoothrng
smrng1 = smoothrng(source, per1, mult1)
smrng2 = smoothrng(source, per2, mult2)
smrng = (smrng1 + smrng2) / 2
rngfilt(x, r) =>
    rngfilt = x
    rngfilt := x > nz(rngfilt[1]) ? x - r < nz(rngfilt[1]) ? nz(rngfilt[1]) : x - r : x + r > nz(rngfilt[1]) ? nz(rngfilt[1]) : x + r
    rngfilt
filt = rngfilt(source, smrng)
upward = 0.0
upward := filt > filt[1] ? nz(upward[1]) + 1 : filt < filt[1] ? 0 : nz(upward[1])
downward = 0.0
downward := filt < filt[1] ? nz(downward[1]) + 1 : filt > filt[1] ? 0 : nz(downward[1])
STR = filt + smrng
STS = filt - smrng
FUB = 0.0
FUB := STR < nz(FUB[1]) or close[1] > nz(FUB[1]) ? STR : nz(FUB[1])
FLB = 0.0
FLB := STS > nz(FLB[1]) or close[1] < nz(FLB[1]) ? STS : nz(FLB[1])
TRF = 0.0
TRF := nz(TRF[1]) == FUB[1] and close <= FUB ? FUB : nz(TRF[1]) == FUB[1] and close >= FUB ? FLB : nz(TRF[1]) == FLB[1] and close >= FLB ? FLB : nz(TRF[1]) == FLB[1] and close <= FLB ? FUB : FUB
al = ta.crossover(close, TRF)
sat = ta.crossunder(close, TRF)
plotshape(showsignals and al, title='Long', text='BUY', style=shape.labelup, textcolor=color.white, size=size.tiny, location=location.belowbar, color=color.rgb(0, 19, 230))
plotshape(showsignals and sat, title='Short', text='SELL', style=shape.labeldown, textcolor=color.white, size=size.tiny, location=location.abovebar, color=color.rgb(0, 19, 230))
alertcondition(al, title='Long', message='Long')
alertcondition(sat, title='Short', message='Short')
Trfff = plot(TRF)
mPlot = plot(ohlc4, title='', style=plot.style_circles, linewidth=0)
longFillColor = close > TRF ? color.green : na
shortFillColor = close < TRF ? color.red : na
fill(mPlot, Trfff, title='UpTrend Highligter', color=longFillColor, transp=90)
fill(mPlot, Trfff, title='DownTrend Highligter', color=shortFillColor, transp=90)

//////////////////////


renk1 = input(true, "Mum Renk Ayarları?")
mumrenk = input(true,title="Trend Bazlı Mum Rengi Değişimi?")
htaColor = renk1 ? (al ? color.rgb(224, 230, 57) : #E56337) : #c92626
barcolor(color = mumrenk ? (renk1 ? htaColor : na) : na)
if (al) and window()
    strategy.entry("Al", strategy.long)
if (sat) and window()
    strategy.entry("Sat", strategy.short)


per1(pcnt) =>
    strategy.position_size != 0 ? math.round(pcnt / 100 * strategy.position_avg_price / syminfo.mintick) : float(na)
zarkesmgb = input.float(title='Zarar Kes Yüzdesi', defval=100, minval=0.01)
zarkeslos = per1(zarkesmgb)
q1 = input.int(title='Satış Lot Sayısı 1.Kısım %', defval=5, minval=1)
q2 = input.int(title='Satış Lot Sayısı 2.Kısım %', defval=8, minval=1)
q3 = input.int(title='Satış Lot Sayısı 3.Kısım %', defval=13, minval=1)
q4 = input.int(title='Satış Lot Sayısı 4.Kısım %', defval=21, minval=1)
tp1 = input.float(title='Kar Yüzdesi 1.Kısım', defval=13, minval=0.01)
tp2 = input.float(title='Kar Yüzdesi 2.Kısım', defval=21, minval=0.01)
tp3 = input.float(title='Kar Yüzdesi 3.Kısım', defval=29, minval=0.01)
tp4 = input.float(title='Kar Yüzdesi 4.Kısım', defval=34, minval=0.01)
strategy.exit('✨KS1', qty_percent=q1, profit=per1(tp1), loss=zarkeslos)
strategy.exit('✨KS2', qty_percent=q2, profit=per1(tp2), loss=zarkeslos)
strategy.exit('✨KS3', qty_percent=q3, profit=per1(tp3), loss=zarkeslos)
strategy.exit('✨KS4', qty_percent=q4, profit=per1(tp4), loss=zarkeslos)