Momentum Trading: Strategi Crossover Rata-rata Pergerakan Ganda

Ringkasan
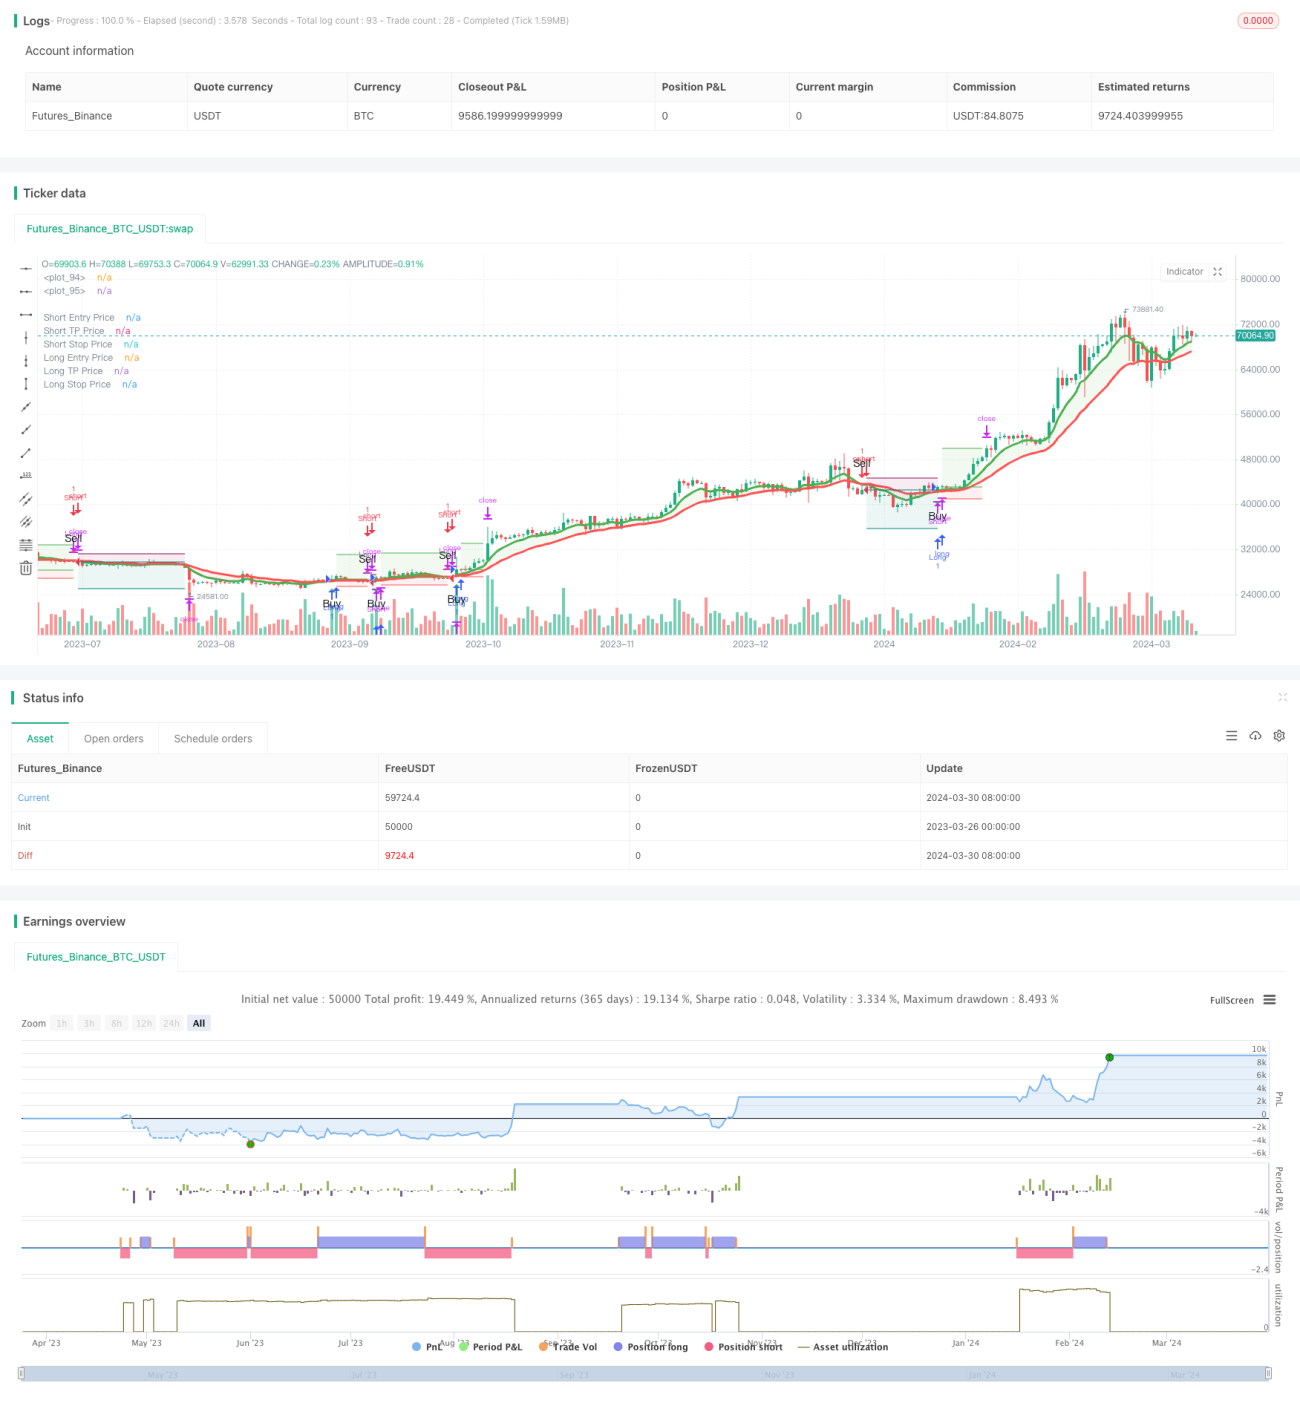
Strategi ini menggunakan indeks bergerak rata-rata ((EMA) dari 8 periode dan 21 periode untuk mengidentifikasi perubahan tren pasar. Ketika EMA periode yang lebih pendek melintasi EMA periode yang lebih panjang dari bawah, menghasilkan sinyal beli; sebaliknya, ketika EMA periode yang lebih pendek melintasi EMA periode yang lebih panjang dari atas, menghasilkan sinyal jual. Strategi ini juga menggabungkan tiga titik rendah berturut-turut yang lebih tinggi ((HLL) dan tiga titik tinggi berturut-turut yang lebih rendah ((LLH) sebagai sinyal untuk mengkonfirmasi pembalikan tren lebih lanjut. Selain itu, strategi ini juga menetapkan level stop loss dan stop loss untuk mengendalikan risiko dan mengunci keuntungan.
Prinsip Strategi
- Menghitung EMA 8 siklus dan 21 siklus untuk mengidentifikasi arah tren utama.
- Identifikasi tiga titik rendah berturut-turut yang lebih tinggi (HLL) dan tiga titik tinggi berturut-turut yang lebih rendah (LLH), sebagai sinyal awal pembalikan tren.
- Ketika 8 siklus EMA dari bawah melintasi 21 siklus EMA, dan terjadi HLL terobosan, menghasilkan sinyal beli; ketika 8 siklus EMA dari atas melintasi 21 siklus EMA, dan terjadi LLH terobosan, menghasilkan sinyal jual.
- Set stop loss level 5% dari harga masuk dan stop loss level 16% dari harga masuk untuk mengontrol risiko dan mengunci keuntungan.
- Ketika muncul sinyal mundur, tutup posisi dan kembali buka posisi.
Keunggulan Strategis
- Kombinasi EMA dan pola perilaku harga ((HLL dan LLH) untuk mengkonfirmasi tren, meningkatkan keandalan sinyal.
- Tetapkan tingkat stop loss dan stop loss yang jelas untuk membantu mengendalikan risiko dan mengunci keuntungan.
- Ada beberapa kerangka waktu dan pasar yang berbeda, dengan beberapa universalitas.
- Logika yang jelas, mudah dipahami dan diterapkan.
Risiko Strategis
- Dalam pasar yang bergejolak, seringnya persilangan dapat menyebabkan beberapa kali sinyal palsu yang mengakibatkan kerugian.
- Tingkat stop loss dan stop loss yang ditetapkan mungkin tidak dapat disesuaikan dengan kondisi pasar yang berbeda, yang menyebabkan potensi biaya peluang atau kerugian yang lebih besar.
- Strategi bergantung pada data historis dan mungkin kurang beradaptasi terhadap peristiwa mendadak atau perubahan fundamental.
Arah optimasi strategi
- Memperkenalkan mekanisme stop loss dan stop adjustment, seperti ATR, untuk menyesuaikan tingkat stop loss dan stop loss berdasarkan volatilitas, agar lebih sesuai dengan kondisi pasar yang berbeda.
- Kombinasi dengan indikator atau faktor lain, seperti volume transaksi, RSI (Relative Strength Index) dan lain-lain, untuk lebih memfilter sinyal dan meningkatkan keandalan.
- Optimalkan parameter (misalnya, siklus EMA, stop loss, stop loss ratio, dll.) untuk menemukan kombinasi parameter yang terbaik untuk pasar atau indikator tertentu.
- Pertimbangkan untuk memperkenalkan langkah-langkah manajemen risiko, seperti posisi sizing, untuk mengendalikan risiko pada transaksi tunggal.
Meringkaskan
Strategi ini memanfaatkan persilangan 8 siklus dan 21 siklus EMA, digabungkan dengan model harga HLL dan LLH, untuk mengidentifikasi pembalikan tren dan menghasilkan sinyal perdagangan. Aturan stop loss yang jelas membantu mengendalikan risiko dan mengunci keuntungan. Namun, strategi ini mungkin menghasilkan sinyal palsu di pasar yang bergolak, dan level stop loss yang tetap mungkin tidak dapat beradaptasi dengan lingkungan pasar yang berbeda.
/*backtest
start: 2023-03-26 00:00:00
end: 2024-03-31 00:00:00
period: 1d
basePeriod: 1h
exchanges: [{"eid":"Futures_Binance","currency":"BTC_USDT"}]
*/

//@version=5
strategy('Trend Following 8&21EMA with strategy tester [ukiuro7]', overlay=true, process_orders_on_close=true, calc_on_every_tick=true, initial_capital = 10000)

//INPUTS- 1