Posisi dinamis SPARK dan strategi perdagangan indikator ganda

Ringkasan
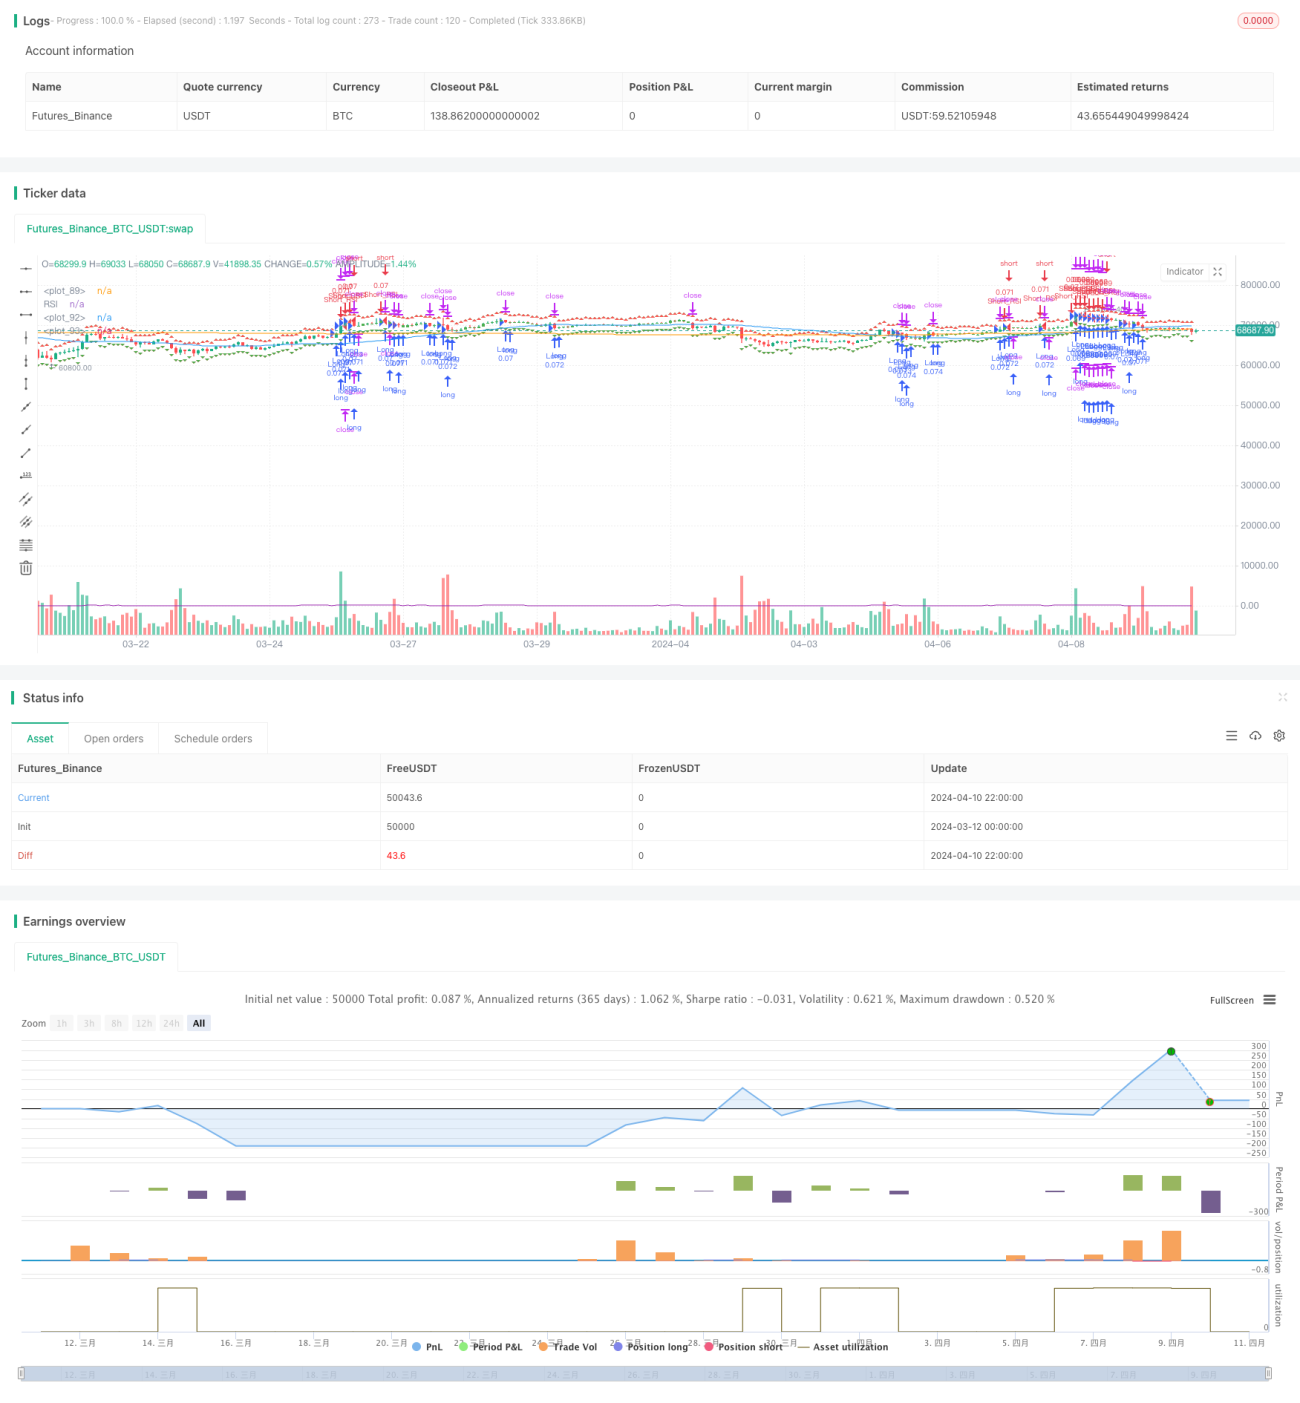
Strategi SPARK adalah strategi perdagangan kuantitatif yang menggabungkan penyesuaian posisi dinamis dan konfirmasi indikator ganda. Strategi ini menggunakan indikator SuperTrend dan indeks relatif kuat (RSI) untuk mengidentifikasi titik masuk dan keluar potensial, sambil menggunakan mekanisme penyesuaian posisi dinamis untuk mengoptimalkan alokasi dana. Strategi ini juga menyediakan pengaturan stop-loss yang fleksibel, serta parameter kustom seperti kontrol frekuensi perdagangan minimum dan pilihan preferensi arah.
Prinsip Strategi
Inti dari strategi SPARK adalah aplikasi gabungan dari indikator SuperTrend dan indikator RSI. Indikator SuperTrend menilai arah tren dengan membandingkan hubungan antara harga penutupan dengan posisi resistensi dukungan dinamis, sedangkan indikator RSI digunakan untuk mengidentifikasi status pasar overbought dan oversold.
Strategi ini menggunakan mekanisme penyesuaian posisi dinamis untuk mengoptimalkan alokasi dana untuk setiap transaksi. Dengan mengatur persentase portofolio dan tingkat leverage, strategi dapat secara otomatis menghitung ukuran posisi optimal berdasarkan kondisi pasar saat ini dan saldo akun. Selain itu, strategi ini juga menyediakan pengaturan stop loss yang fleksibel, yang dapat dipilih dengan persentase tetap atau cara perhitungan dinamis.
Keunggulan Strategis
- Konfirmasi indikator ganda: Dengan menggabungkan dua indikator SuperTrend dan RSI, strategi SPARK dapat lebih akurat mengidentifikasi titik masuk dan keluar potensial, mengurangi kemungkinan kesalahan penilaian.
- Penyesuaian posisi dinamis: Strategi ini menggunakan mekanisme penyesuaian posisi dinamis, yang dapat secara otomatis mengoptimalkan alokasi dana untuk setiap transaksi berdasarkan persentase portofolio dan tingkat leverage, meningkatkan efisiensi penggunaan dana.
- Manajemen risiko yang fleksibel: Strategi memberikan pengaturan stop-loss yang fleksibel, yang dapat dipilih berdasarkan preferensi risiko pribadi dengan persentase tetap atau perhitungan dinamis, untuk mengendalikan risiko yang tepat.
- Kustomisasi parameter: Strategi memungkinkan pengguna untuk menyesuaikan beberapa parameter input seperti panjang ATR, perkalian, RSI threshold, dan lain-lain untuk menyesuaikan dengan kondisi pasar yang berbeda dan preferensi perdagangan.
Risiko Strategis
- Risiko pasar: Meskipun strategi SPARK menggunakan mekanisme konfirmasi indikator ganda dan pengaturan posisi dinamis, risiko kerugian masih mungkin terjadi dalam kondisi pasar yang ekstrim.
- Risiko optimasi parameter: kinerja strategi sangat bergantung pada pilihan parameter input. Pengaturan parameter yang tidak tepat dapat menyebabkan kinerja strategi yang buruk.
- Risiko over-fit: Jika parameter strategi dioptimalkan secara berlebihan, strategi tersebut mungkin akan berkinerja buruk dalam kondisi pasar di masa depan.
Arah optimasi strategi
- Memperkenalkan lebih banyak indikator: Pertimbangkan untuk memperkenalkan indikator teknis lainnya, seperti MACD, Brinband, dan lain-lain, untuk meningkatkan akurasi pengakuan sinyal lebih lanjut.
- Mengoptimalkan Stop Loss: Menjelajahi strategi stop loss yang lebih canggih, seperti stop loss bergerak, stop loss dinamis, dan lain-lain, untuk lebih melindungi keuntungan dan membatasi kerugian.
- Adaptasi parameter: Mengembangkan mekanisme adaptasi, menyesuaikan parameter strategi sesuai dengan situasi pasar yang dinamis, untuk menyesuaikan diri dengan lingkungan pasar yang terus berubah.
Meringkaskan
Strategi SPARK menyediakan pedagang dengan solusi perdagangan kuantitatif yang komprehensif dengan menggabungkan indikator SuperTrend dan RSI, dan menggunakan mekanisme penyesuaian posisi dinamis dan alat manajemen risiko yang fleksibel. Meskipun strategi mungkin menghadapi beberapa risiko, dengan terus-menerus mengoptimalkan dan memperbaiki, strategi SPARK diharapkan untuk mencapai kinerja yang stabil dalam berbagai kondisi pasar.
- 1