Strategi perdagangan grid rebound oversold indikator skala besar Wavetrend

Ringkasan
Strategi ini didasarkan pada indikator Wavetrend, dengan menetapkan beberapa tingkat oversold dan oversold, membangun posisi multihead ketika harga menyentuh level ini, dan mengambil keuntungan dari posisi terendah ketika harga membalik ke level oversold. Ini adalah strategi perdagangan grid yang dirancang untuk menangkap gerakan bouncing dan overbought di pasar, berlaku untuk siklus 15 menit untuk mata uang digital seperti Bitcoin dan Solana.
Prinsip Strategi
- Hitung dua garis indikator Wavetrend, satu untuk nilai awal ((wt1)), dan satu untuk nilai rata ((wt2) <unk>
- Siapkan beberapa tingkat oversell (oslevel1 ~ 8) dan tingkat overbuy (Oblevel1 ~ 5).
- Ketika wt1 dan wt2 pada saat yang sama berada di bawah suatu level oversold, dan wt1 berada di atas wt2, bukalah posisi multihead.
- Ketika wt1 dan wt2 berada di atas level overbought 1, dan wt1 berada di bawah wt2, maka 70% dari posisi overhead akan dihapus.
- Ulangi langkah 3 dan 4 untuk membangun sistem perdagangan grid.
Keunggulan Strategis
- Capture oversold rebound: Mengambil keuntungan dari rebound dengan mengatur beberapa level oversold dan membuka posisi setelah harga turun drastis.
- Bangun gudang dalam jumlah besar, kendalikan risiko: Berdasarkan tingkat jual super, bangun gudang dalam jumlah besar, semakin rendah tingkatnya, semakin berat posisi, lebih baik mengendalikan risiko.
- Stop otomatis: Menghapus sebagian besar posisi secara otomatis saat harga melesat ke zona overbought, mengunci keuntungan.
- Fleksibilitas parameter: Tingkat oversold dan oversold dapat disesuaikan dengan karakteristik pasar dan preferensi pribadi, untuk menyesuaikan dengan varietas dan siklus perdagangan yang berbeda.
Risiko Strategis
- Risiko kejatuhan: Jika harga terus turun, akan memicu sinyal over-sell untuk membuka lebih banyak posisi, yang dapat menyebabkan posisi berat ditutup.
- Risiko pasar yang bergoyang: Jika harga bergoyang berulang kali di area oversold, mungkin menyebabkan beberapa kali membuka posisi dan tidak dapat berhenti, sehingga melemahkan efektivitas strategi.
- Risiko parameter: pengaturan parameter yang berbeda sangat berpengaruh pada kinerja strategi, yang perlu dioptimalkan berdasarkan umpan balik dan pengalaman, atau dapat menyebabkan kerugian.
Arah optimasi strategi
- Tambahkan filter tren: sebelum membuka posisi, pertimbangkan apakah tren tingkat besar naik atau tidak, dan hindari membuka posisi dalam tren turun.
- Optimalkan manajemen posisi: Sesuai dengan jarak harga dari tingkat oversold, sesuaikan ukuran posisi terbuka, semakin jauh dari posisi.
- Stop-loss dinamis: Stop-loss yang disesuaikan secara dinamis dengan rasio keuntungan dan kerugian dari posisi yang dipegang, bukan rasio posisi yang tetap.
- Tambahkan Stop Loss: Tetapkan Stop Loss yang tetap atau dilacak untuk mengontrol kerugian maksimum dalam satu transaksi.
Meringkaskan
Wavetrend besar indikator oversold rebound grid strategi perdagangan adalah strategi kuantitatif berdasarkan sinyal oversold overbuy, dengan cara batch membangun posisi dan stop otomatis, mencoba untuk menangkap rebound setelah oversold, mengambil keuntungan dari harga selisih. Keuntungan dari strategi ini adalah kuat beradaptasi, dapat menyesuaikan parameter secara fleksibel, tetapi juga ada risiko pasar terus turun, parameter pengaturan yang tidak tepat dan lain-lain. Dalam aplikasi praktis, dapat dipertimbangkan untuk menambahkan metode optimasi kerugian seperti penyaringan tren, posisi dinamis dan stop stop untuk meningkatkan kebugaran strategi dan profitabilitas.
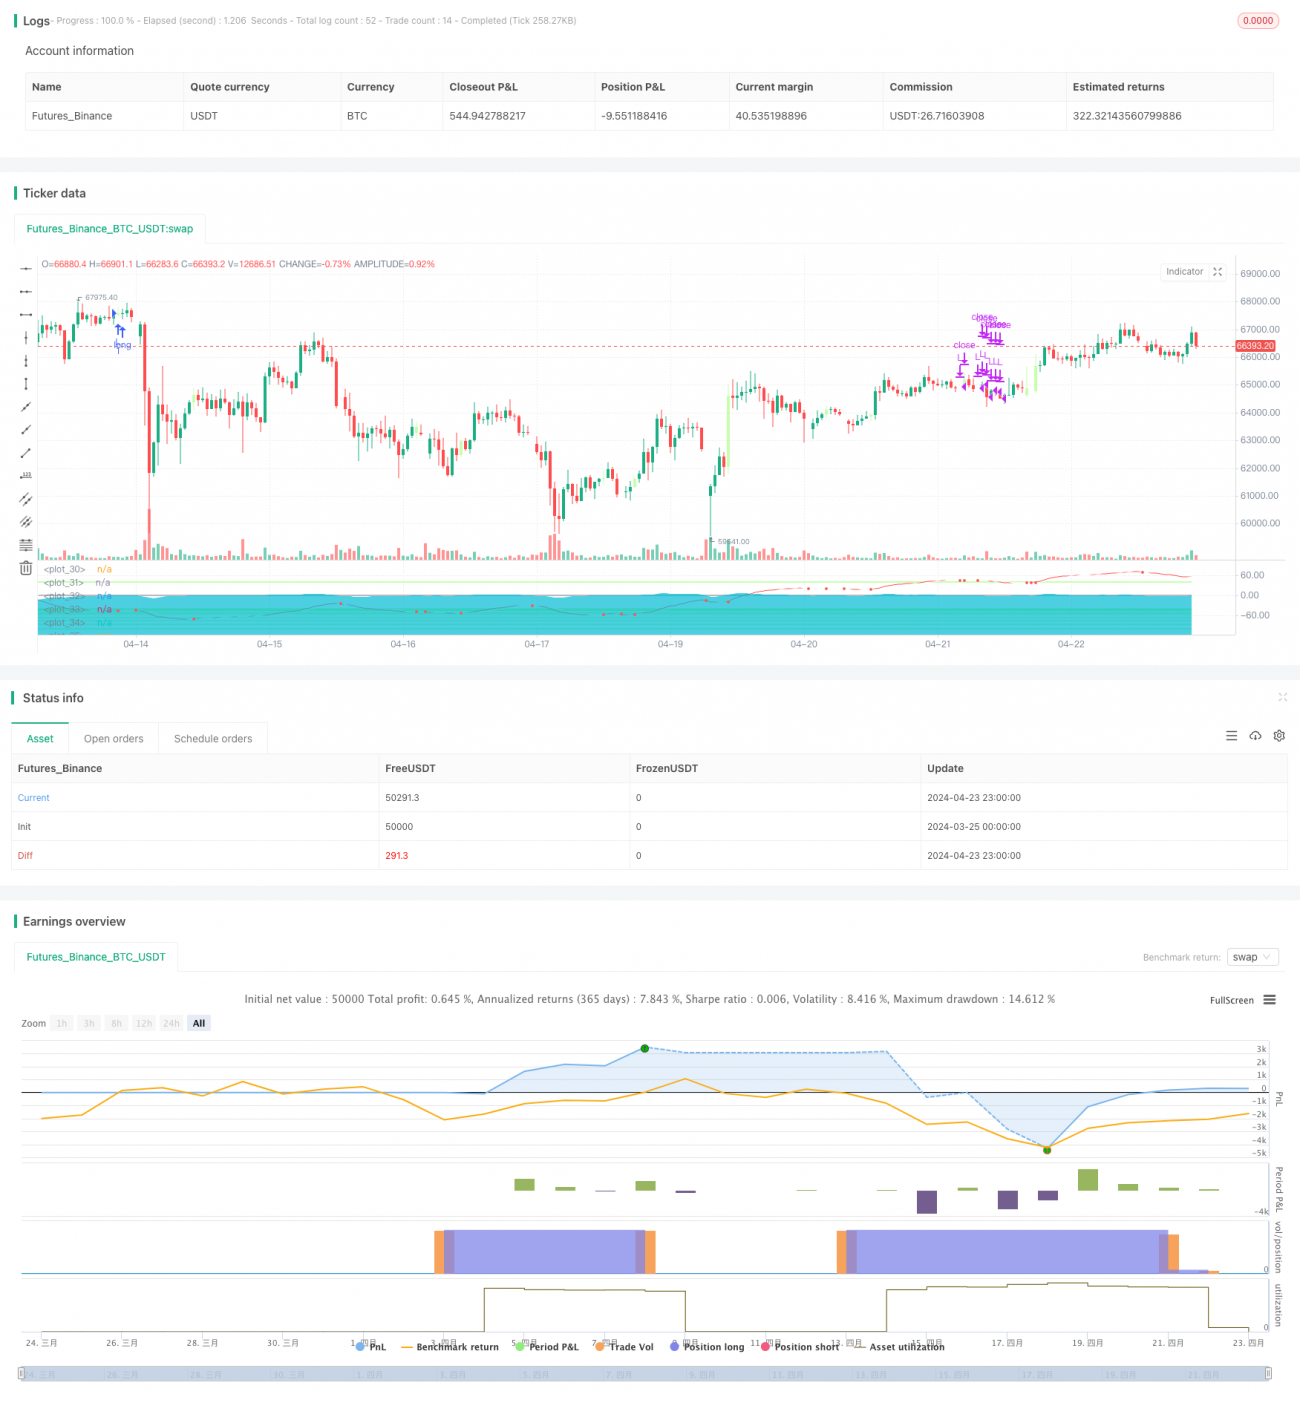
/*backtest
start: 2024-03-25 00:00:00
end: 2024-04-24 00:00:00
period: 1h
basePeriod: 15m
exchanges: [{"eid":"Futures_Binance","currency":"BTC_USDT"}]
*/

//@version=5
// © And Isaac, all rights reserved. If there is any piracy, please call the police immediately.

strategy(title='wavetrend',shorttitle='DCA-High win rate quantitative trading')- 1