Strategi Keuntungan Multilayer Crossover Rata-rata Bergerak

Ringkasan
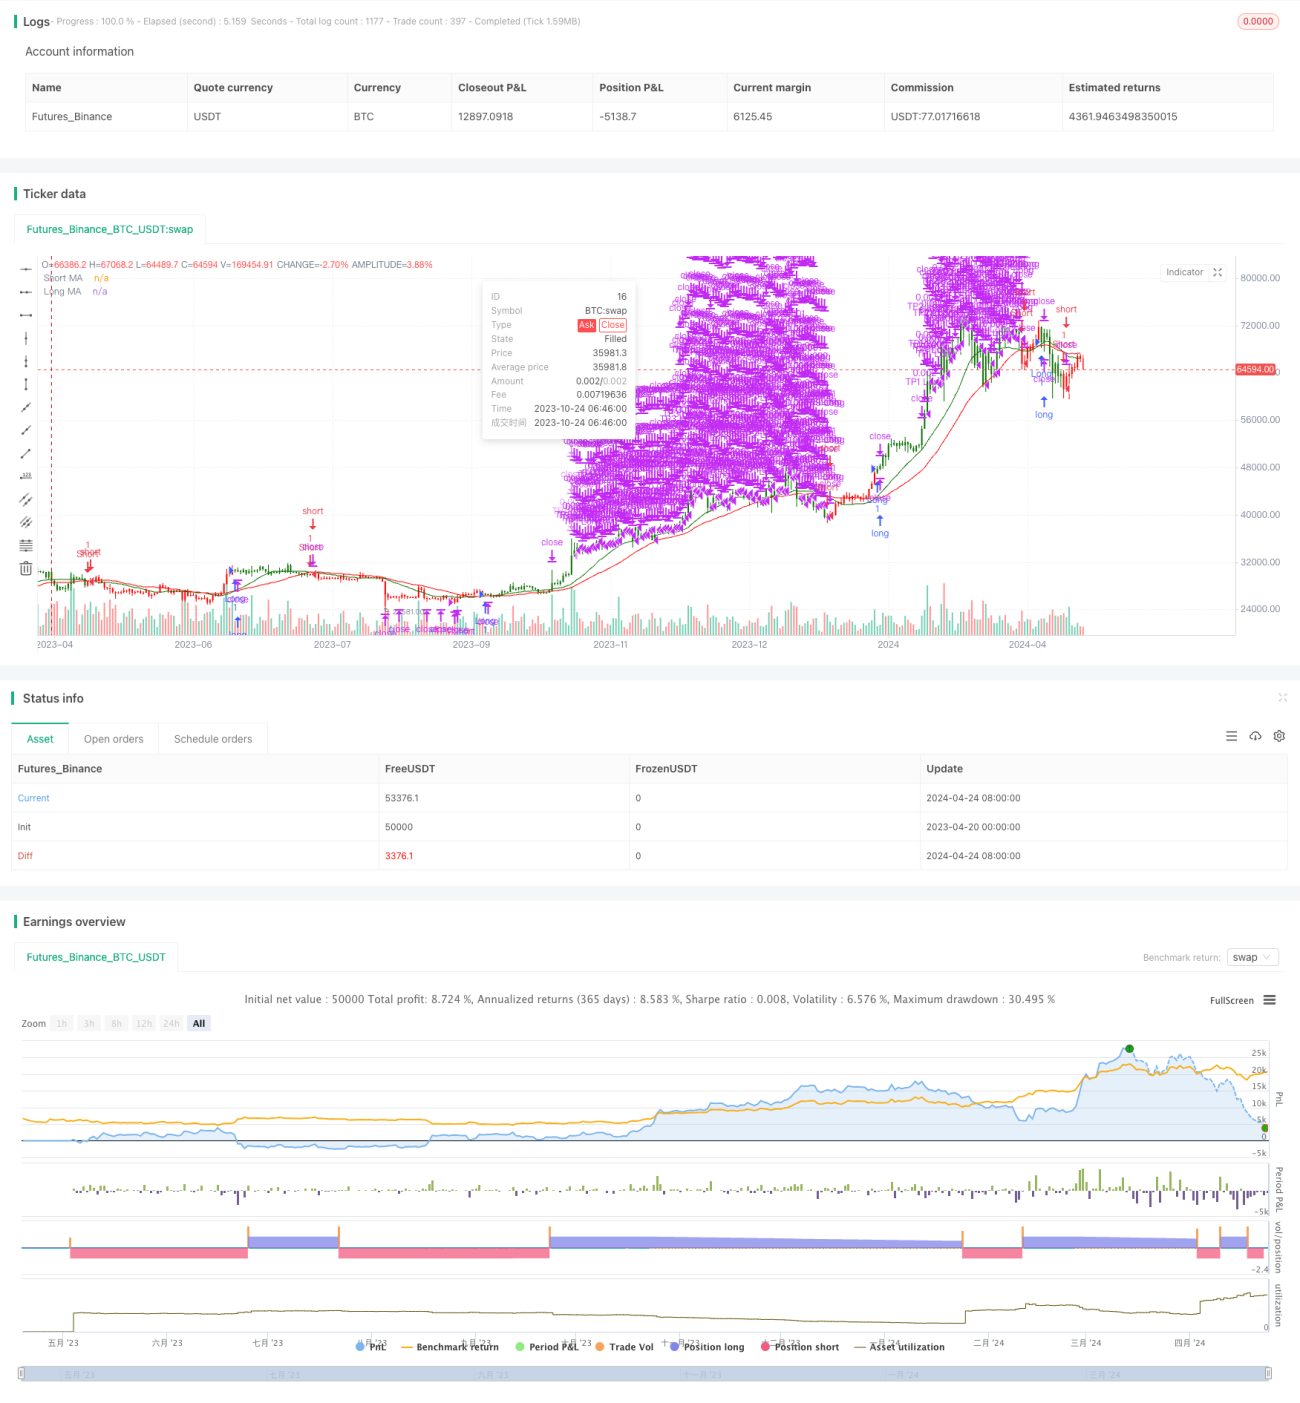
Strategi ini menggunakan persilangan dua rata-rata bergerak untuk menilai tren pasar, membuka lebih banyak posisi saat melewati rata-rata bergerak jangka panjang pada rata-rata bergerak jangka pendek, dan sebaliknya membuka posisi kosong. Pada saat yang sama, strategi ini menggunakan metode multi-tahap yang menguntungkan, dan ketika harga mencapai tingkat keuntungan yang ditentukan, posisi ditutup secara bertahap, sehingga memaksimalkan keuntungan dan mengendalikan risiko.
Prinsip Strategi
Inti dari strategi ini adalah menggunakan rata-rata bergerak dari berbagai siklus untuk menangkap tren pasar. Ketika rata-rata bergerak jangka pendek di atas rata-rata bergerak jangka panjang, berarti pasar mungkin masuk ke tren naik, dan membuka lebih banyak posisi. Ketika rata-rata bergerak jangka pendek di bawah rata-rata bergerak jangka panjang, berarti pasar mungkin masuk ke tren turun, dan membuka posisi kosong.
Keunggulan Strategis
- Sederhana dan efektif: Strategi ini didasarkan pada prinsip-prinsip lintas rata-rata bergerak klasik, sederhana dan mudah dimengerti, serta terbukti efektif dalam praktik.
- Multilevel profit-taking: Dengan menetapkan beberapa tingkat profit, dan dengan melakukan batch-clearing ketika harga mencapai tingkat tersebut, Anda dapat memaksimalkan keuntungan, sekaligus mengendalikan risiko.
- Fleksibilitas parameter: Pengaturan parameter strategi ini sangat fleksibel, sehingga pengguna dapat menyesuaikan siklus moving average dan tingkat keuntungan sesuai dengan kebutuhan dan karakteristik pasar mereka sendiri untuk mendapatkan efek optimal.
Risiko Strategis
- Risiko volatilitas pasar: Ketika pasar mengalami fluktuasi yang kuat, sinyal silang yang sering dapat menyebabkan strategi perdagangan yang sering, meningkatkan biaya perdagangan dan risiko penarikan balik.
- Risiko pengaturan parameter: pengaturan parameter yang tidak tepat dapat menyebabkan kinerja strategi yang buruk, seperti siklus rata-rata bergerak yang tidak tepat dipilih, atau pengaturan tingkat keuntungan yang tidak masuk akal, dll.
- Risiko identifikasi tren: Strategi ini sangat bergantung pada tren, dan pada saat pasar bergejolak atau tren tidak jelas, sinyal palsu dapat muncul lebih banyak dan menyebabkan kerugian.
Arah optimasi strategi
- Kombinasi dengan indikator lain: Pertimbangan untuk menggabungkan dengan indikator teknis lainnya, seperti RSI, MACD, dll, dapat dilakukan untuk meningkatkan akurasi dan keandalan identifikasi tren.
- Parameter optimasi: dapat dilakukan pengamatan ulang dan optimasi untuk mencari siklus rata-rata bergerak optimal dan parameter tingkat keuntungan yang sesuai dengan kondisi pasar yang berbeda.
- Menambahkan Stop Loss: Anda dapat mempertimbangkan untuk menambahkan mekanisme stop loss untuk mengontrol risiko lebih lanjut, seperti stop loss dinamis berdasarkan pengaturan ATR, dll.
- Perubahan masuk dan keluar: Anda dapat mengeksplorasi lebih banyak kondisi masuk dan keluar, seperti mempertimbangkan volume transaksi, resistensi dukungan, dan faktor-faktor lainnya, untuk meningkatkan stabilitas strategi.
Meringkaskan
Sebuah strategi multi-layered keuntungan bergerak rata-rata cross adalah strategi yang sederhana dan efektif untuk melacak tren, dengan cara multi-layered keuntungan yang berakhir, Anda bisa mendapatkan lebih banyak keuntungan dalam tren, sementara mengendalikan risiko. Namun, strategi ini juga memiliki beberapa keterbatasan dan risiko, yang perlu dioptimalkan dan ditingkatkan sesuai dengan kondisi pasar tertentu dan kebutuhan pengguna. Secara keseluruhan, strategi ini dapat berfungsi sebagai alat perdagangan yang efektif, tetapi tidak dapat sepenuhnya bergantung, perlu dikombinasikan dengan metode analisis lainnya dan langkah-langkah manajemen risiko untuk mencapai efek optimal.
/*backtest
start: 2023-04-20 00:00:00
end: 2024-04-25 00:00:00
period: 1d
basePeriod: 1h
exchanges: [{"eid":"Futures_Binance","currency":"BTC_USDT"}]
*/

// This Pine Script™ code is subject to the terms of the Mozilla Public License 2.0 at https://mozilla.org/MPL/2.0/
// © ValdesTradingBots

//Follow Us for More Insights and Updates!- 1