Strategi Kuantitatif Sinyal Crossover RSI dan Double EMA

Ringkasan
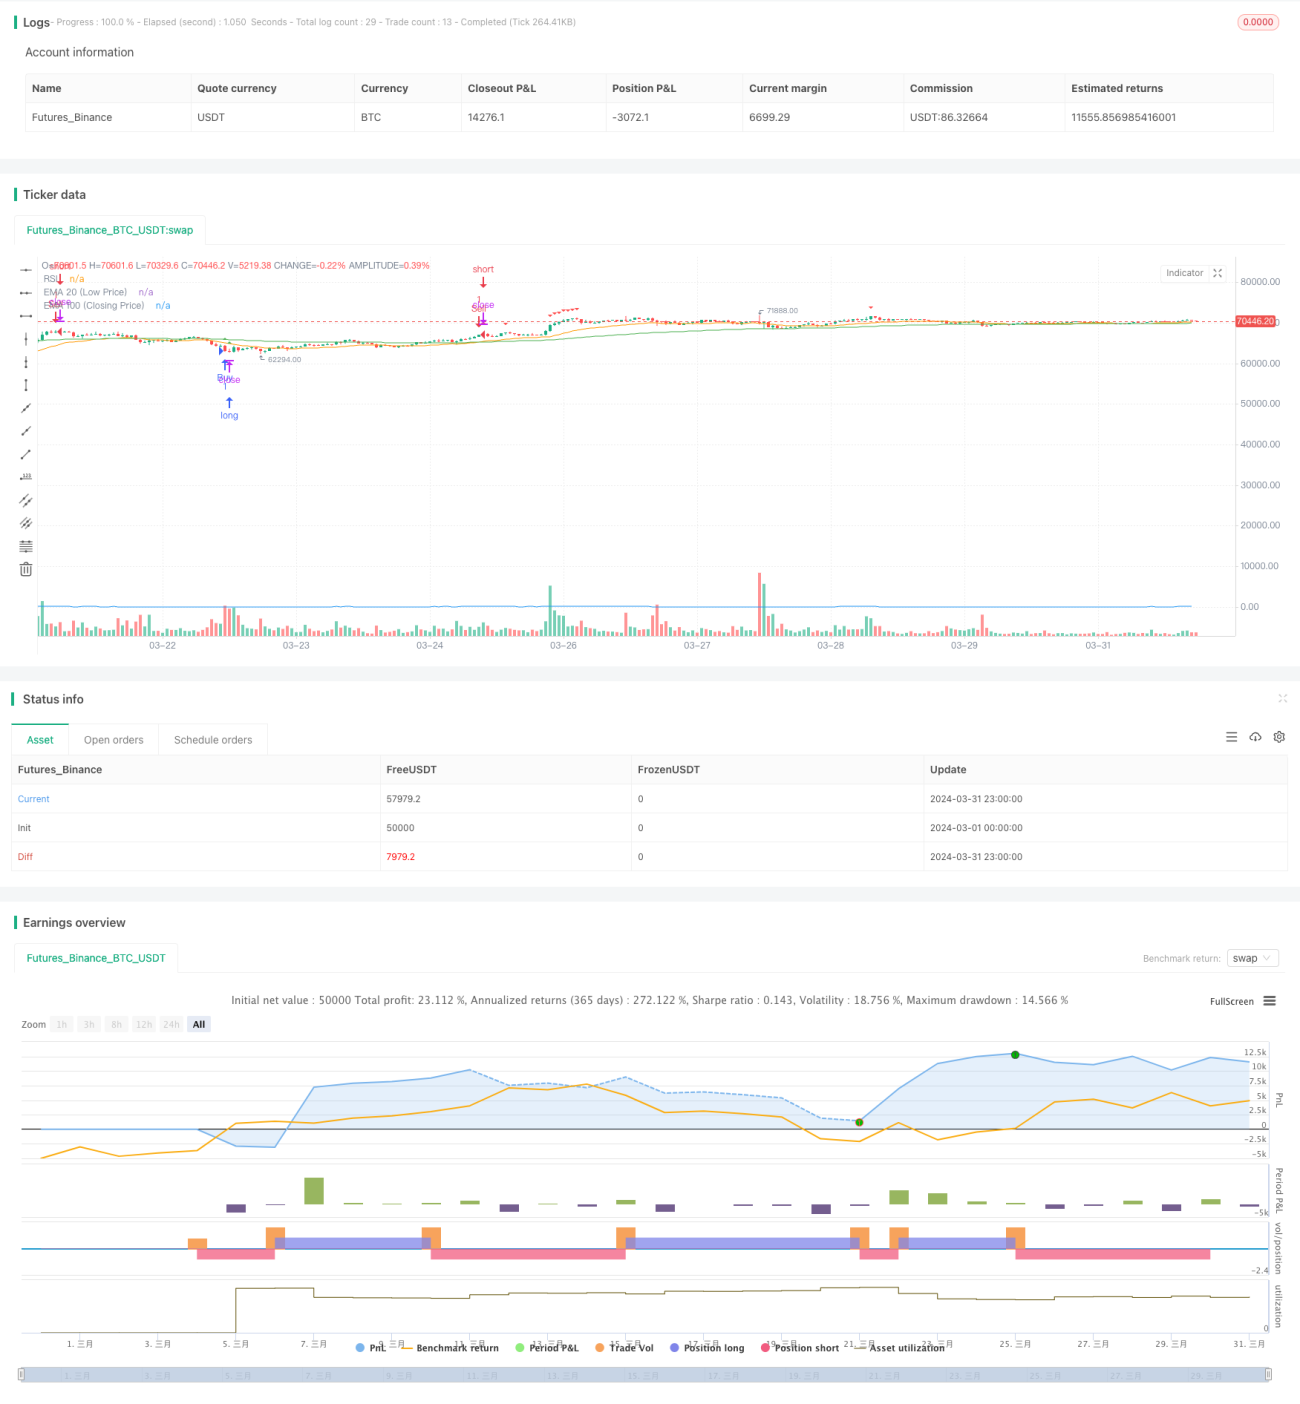
Strategi ini didasarkan pada indikator RSI dan sinyal silang dua garis EMA untuk menentukan titik jual. Ini menghasilkan sinyal beli ketika harga close out jatuh di bawah EMA100 dan EMA20 dan nilai RSI di bawah 30. Ini menghasilkan sinyal jual ketika harga close out menembus EMA100 dan EMA20 dan nilai RSI di atas 70.
Prinsip Strategi
- RSI dihitung untuk menentukan apakah pasar sedang oversold atau oversold. RSI di bawah 30 dianggap sebagai oversold dan di atas 70 dianggap sebagai oversold.
- Dua garis rata untuk menghitung harga tutup EMA100 dan harga terendah EMA20 sebagai dasar untuk menilai tren.
- Ketika harga close out di bawah EMA100 dan EMA20 dan RSI di bawah 30, maka akan terjadi oversold dan downtrend yang menghasilkan sinyal buy.
- Ketika harga penutupan menembus EMA100 dan EMA20, dan nilai RSI lebih tinggi dari 70, dinilai sebagai overbought dan tren ke atas, menghasilkan sinyal jual.
- Jika Anda membeli, Anda membuka lebih banyak posisi saat sinyal berbunyi, dan jika Anda menjual, Anda menutup posisi saat sinyal berbunyi.
Analisis Keunggulan
- Kombinasi indikator RSI dengan garis rata-rata EMA dapat lebih baik menilai titik-titik tren dan waktu overbought dan oversold, mengurangi sinyal yang salah.
- Parameter dapat disesuaikan, dapat dioptimalkan sesuai dengan standar dan periode yang berbeda, memiliki kemampuan adaptasi dan fleksibilitas tertentu.
- Logika sederhana dan jelas, mudah dipahami dan diterapkan, tidak memerlukan banyak dasar analisis teknis.
- Ini cocok untuk digunakan ketika terjadi gejolak pasar, dapat menangkap titik tinggi dan rendah dari fluktuasi, dan mengambil keuntungan dari perbedaan harga.
Analisis risiko
- Untuk tren unilateral mungkin tidak berhasil, setelah tren terbentuk akan menghasilkan sinyal yang salah secara berturut-turut.
- Parameter tetap, kurangnya kemampuan untuk beradaptasi dengan pasar yang dinamis, mudah terpengaruh oleh perubahan ritme pasar.
- Perdagangan yang sering terjadi dalam situasi yang bergejolak dapat menyebabkan slippage dan biaya yang lebih besar, yang mempengaruhi keuntungan strategi.
- Kurangnya manajemen posisi dan pengendalian risiko, penarikan dan kerugian maksimum tidak terkendali.
Arah optimasi
- Menambahkan kriteria penilaian tren, seperti MA crossing, DMI, dan lain-lain, untuk menghindari masuk terlalu dini dalam tren unilateral.
- Optimalkan parameter RSI dan EMA untuk menemukan kombinasi parameter yang paling sesuai dengan standar dan siklus, meningkatkan akurasi sinyal.
- Model manajemen posisi, seperti ATR posisi atau rumus Kelly, untuk mengontrol proporsi dana per transaksi, mengurangi risiko.
- Tetapkan kondisi stop loss dan stop loss, seperti stop loss persentase tetap atau stop loss bergerak, untuk mengontrol kerugian maksimum dalam satu transaksi dan pengembalian keuntungan.
- Kombinasi dengan indikator tambahan seperti MACD, Brin band, dan lain-lain, meningkatkan konfirmasi sinyal dan mengurangi kesalahan penilaian.
Meringkaskan
Strategi kuantitatif RSI dengan sinyal silang ganda EMA adalah strategi perdagangan kuantitatif yang sederhana dan praktis, dengan menggabungkan indikator RSI dengan garis rata-rata EMA, dapat lebih baik menangkap titik tinggi dan rendah dalam situasi yang bergolak, untuk melakukan arbitrage perbedaan harga. Namun, strategi ini juga memiliki beberapa keterbatasan dan risiko, seperti kegagalan dalam situasi tren, kurangnya manajemen posisi dan langkah-langkah pengendalian risiko, dll. Oleh karena itu, dalam aplikasi nyata, ada juga kebutuhan untuk melakukan optimasi dan perbaikan yang sesuai sesuai dengan karakteristik pasar dan preferensi pribadi, untuk meningkatkan stabilitas dan profitabilitas strategi.
- 1