Strategi beli dan jual berdasarkan peta panas volume dan harga waktu nyata

Ringkasan
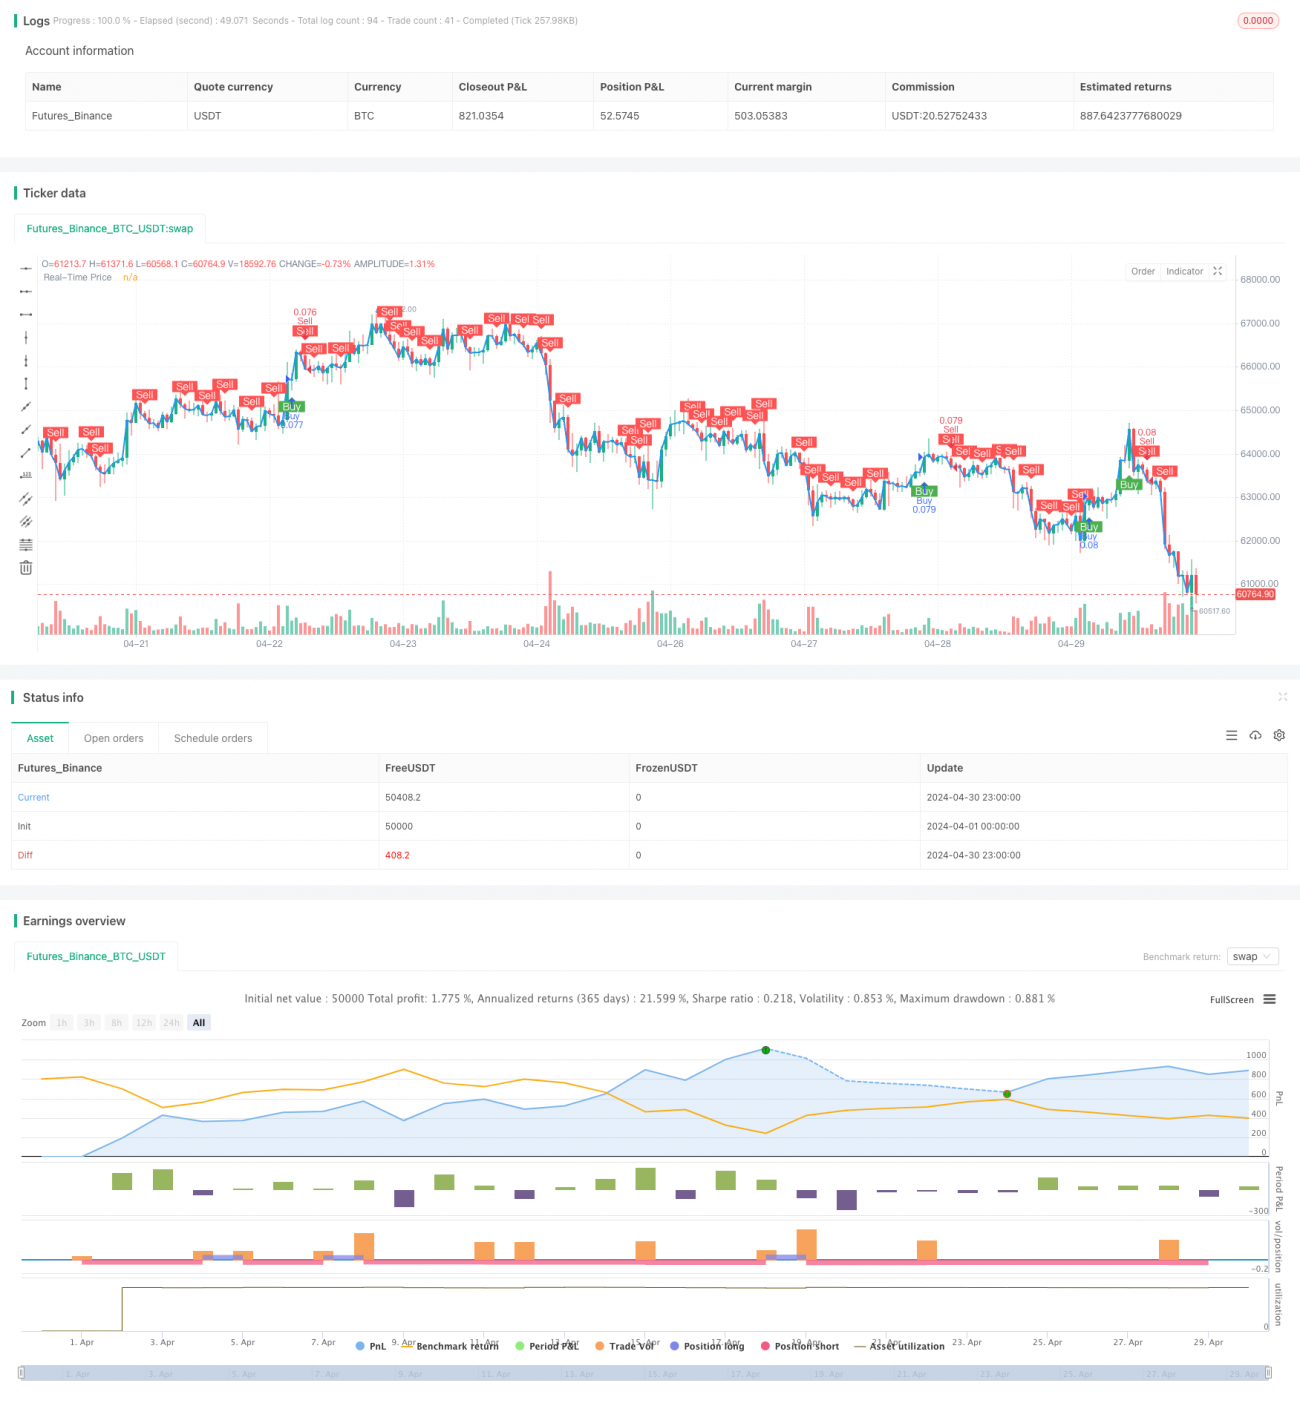
Strategi ini menggabungkan grafik panas volume transaksi dan harga real-time untuk menghasilkan sinyal jual beli dengan menganalisis harga dan distribusi volume transaksi dalam jangka waktu tertentu. Strategi ini pertama-tama menghitung beberapa tingkat harga berdasarkan persentase harga saat ini dan kisaran harga yang ditetapkan. Kemudian menghitung volume jual beli setiap tingkat harga dalam jangka waktu yang lalu dan menghitung volume jual beli yang terakumulasi.
Prinsip Strategi
- Beberapa tingkat harga dihitung berdasarkan harga saat ini dan persentase dari kisaran harga yang ditetapkan.
- Perhitungkan volume transaksi jual beli pada setiap tingkat harga selama periode waktu yang lalu, dan hitung jumlah transaksi jual beli yang terakumulasi.
- Tentukan warna label, dan tampilkan label atau gambar berdasarkan jumlah transaksi pembelian dan penjualan yang terakumulasi.
- Menggambar kurva harga real-time.
- Menghitung indikator seperti EMA, VWAP.
- Berdasarkan hubungan antara harga dengan indikator seperti EMA, VWAP dan kondisi volume transaksi, dinilai apakah kondisi pembelian terpenuhi. Jika terpenuhi dan tidak ada sinyal sebelumnya, sinyal beli dihasilkan.
- Berdasarkan hubungan antara harga dengan indikator seperti EMA dan kondisi volume transaksi, menilai apakah memenuhi syarat jual. Jika memenuhi dan tidak pernah menghasilkan sinyal sebelumnya, maka menghasilkan sinyal jual. Jika dua garis negatif berturut-turut dan tidak pernah menghasilkan sinyal sebelumnya, maka menghasilkan sinyal jual.
- Mencatat kondisi saat ini dan memperbarui status sinyal.
Analisis Keunggulan
- Kombinasi grafik panas volume transaksi dan harga real-time, dapat secara intuitif menunjukkan distribusi harga dan volume transaksi, memberikan referensi untuk keputusan perdagangan.
- Menggunakan indikator seperti EMA, VWAP, dan lain-lain untuk memperkaya penilaian kondisional strategi, meningkatkan keandalan strategi.
- Selain itu, faktor-faktor seperti harga, indikator, dan volume transaksi juga dipertimbangkan untuk membuat sinyal jual beli lebih komprehensif dan lebih kuat.
- Setting the limitation conditions of the signal generation, menghindari terjadinya pengulangan sinyal secara berurutan, dan mengurangi sinyal yang menyesatkan.
Analisis risiko
- Kinerja strategi dapat dipengaruhi oleh pengaturan parameter seperti persentase kisaran harga, periode pengembalian, dan lain-lain, yang perlu disesuaikan dan dioptimalkan sesuai dengan situasi spesifik.
- Indikator seperti EMA, VWAP, dan lain-lain juga memiliki keterlambatan dan keterbatasan, dan dalam beberapa kondisi pasar mungkin tidak berlaku.
- Strategi ini terutama berlaku untuk pasar yang cenderung kuat, di mana pasar yang bergoyang dapat menghasilkan lebih banyak sinyal palsu.
- Strategi pengendalian risiko yang relatif sederhana, kurangnya sarana manajemen risiko seperti stop loss dan manajemen posisi.
Arah optimasi
- Memperkenalkan lebih banyak indikator teknis dan indikator sentimen pasar, seperti RSI, MACD, dan Bollinger Bands, untuk memperkaya dasar penilaian strategi.
- Optimalkan kondisi untuk menghasilkan sinyal jual beli, meningkatkan akurasi dan keandalan sinyal. Anda dapat mempertimbangkan untuk memasukkan analisis beberapa kerangka waktu untuk mengkonfirmasi arah tren.
- Menambahkan langkah-langkah pengendalian risiko seperti pengelolaan stop loss dan posisi, mengatur stop loss dan ukuran posisi yang masuk akal, dan mengontrol ambang risiko transaksi tunggal.
- Optimasi dan pengujian parameter terhadap strategi untuk menemukan kombinasi parameter dan ruang lingkup pasar yang optimal.
- Pertimbangkan untuk menggabungkan strategi ini dengan strategi lain untuk memanfaatkan keunggulan dari strategi yang berbeda dan meningkatkan stabilitas dan keuntungan secara keseluruhan.
Meringkaskan
Strategi ini menggabungkan grafik panas volume, harga real-time dan beberapa indikator teknis untuk menghasilkan sinyal jual beli dengan nilai acuan tertentu. Keuntungan dari strategi ini adalah kemampuan untuk secara visual menunjukkan distribusi harga dan volume transaksi, dan mempertimbangkan berbagai faktor untuk menghasilkan sinyal. Namun, strategi ini juga memiliki beberapa keterbatasan dan risiko, seperti pengaruh pengaturan parameter, keterbelakangan indikator, ketergantungan pada tren pasar, dll. Oleh karena itu, dalam aplikasi praktis, perlu lebih banyak strategi yang dioptimalkan dan disempurnakan, seperti memperkenalkan lebih banyak indikator, mengoptimalkan kondisi sinyal, meningkatkan kontrol risiko, dll.
/*backtest
start: 2024-04-01 00:00:00
end: 2024-04-30 23:59:59
period: 1h
basePeriod: 15m
exchanges: [{"eid":"Futures_Binance","currency":"BTC_USDT"}]
*/

//@version=5
strategy("Buy and Sell Volume Heatmap with Real-Time Price Strategy", overlay=true, default_qty_type=strategy.percent_of_equity, default_qty_value=10)

// Settings for Volume Heatmap- 1