Strategi optimasi mekanisme pasar long-short berdasarkan volatilitas dan garis regresi

Ringkasan
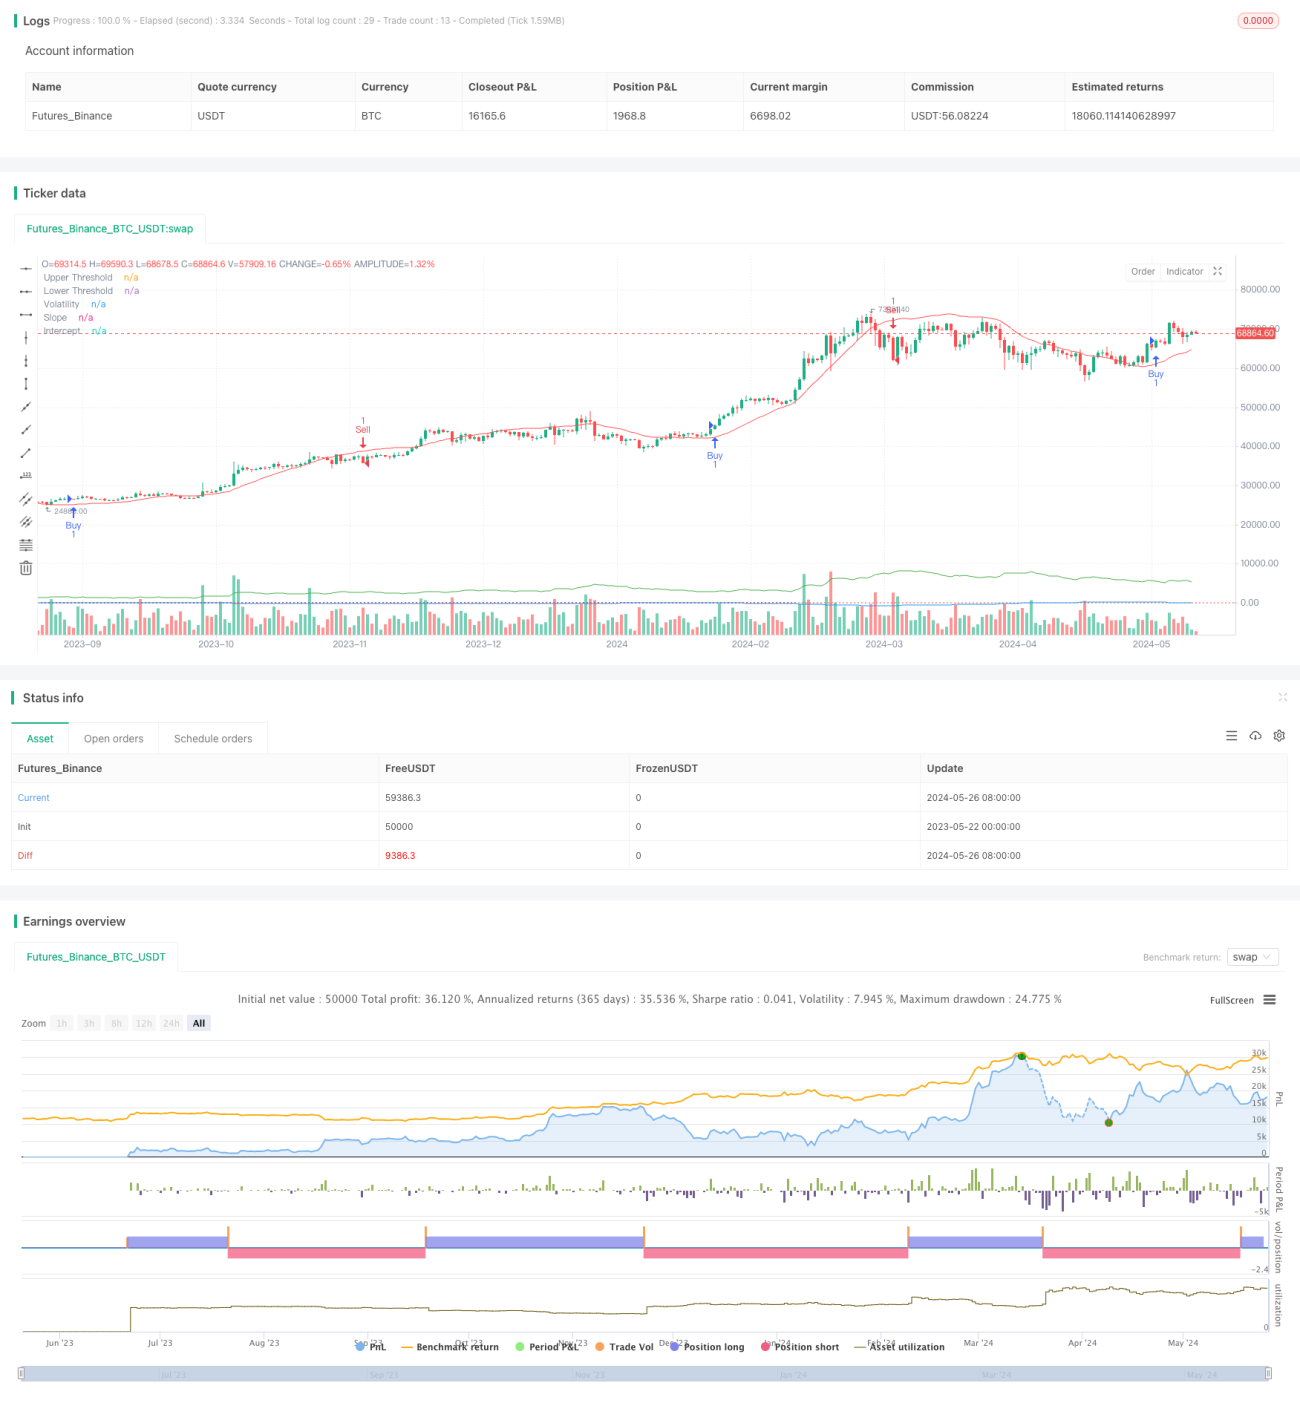
Strategi ini menggunakan regressi linier dan indikator volatilitas untuk mengidentifikasi berbagai kondisi pasar, dan ketika kondisi pembelian atau penjualan terpenuhi, strategi ini akan membangun posisi overhead atau kosong yang sesuai. Strategi ini juga memungkinkan untuk mengoptimalkan dan menyesuaikan parameter sesuai dengan kondisi pasar untuk menyesuaikan diri dengan lingkungan pasar yang berbeda. Strategi ini juga menggunakan indeks moving average sebagai indikator tambahan untuk mengkonfirmasi sinyal perdagangan.
Prinsip Strategi
- Perhitungan jarak dan slope dari regresi linier untuk menentukan tren pasar.
- Hitung rata-rata fluktuasi aktual (ATR) dengan mengalikannya sebagai indikator fluktuasi.
- Ketika slope lebih besar dari kenaikan dan harga lebih tinggi dari garis pengembalian ditambah volatilitas, menghasilkan sinyal beli.
- Sinyal jual dihasilkan ketika kemiringan lebih kecil dari nilai penurunan dan harga lebih rendah dari garis kemunduran dikurangi fluktuasi.
- Penggunaan rata-rata bergerak indeks cepat dan lambat (EMA) sebagai indikator konfirmasi tambahan.
- Ketika sinyal beli muncul dan EMA cepat lebih tinggi dari EMA lambat, posisi multi-head dibuat.
- Bila ada sinyal jual dan EMA cepat lebih rendah dari EMA lambat, maka posisi kosong akan dibuat.
Keunggulan Strategis
- Kombinasi linear regression dan indikator volatilitas, dapat lebih akurat mengidentifikasi kondisi dan tren pasar.
- Menggunakan indikator EMA tambahan untuk mengkonfirmasi sinyal perdagangan, meningkatkan keandalan strategi.
- Hal ini memungkinkan untuk mengoptimalkan parameter-parameter kunci untuk menyesuaikan dengan lingkungan pasar yang berbeda dan karakteristik varietas.
- Dengan mempertimbangkan tren dan fluktuasi, Anda dapat mengambil posisi tepat waktu ketika tren jelas, dan mengendalikan risiko jika fluktuasi meningkat.
Risiko Strategis
- Pemilihan parameter yang tidak tepat dapat menyebabkan kinerja strategi yang buruk, yang perlu dioptimalkan sesuai dengan varietas dan karakteristik pasar tertentu.
- Strategi ini dapat terjadi pada saat pasar bergoyang atau saat tren berbalik, dengan adanya perdagangan yang sering atau sinyal yang salah.
- Strategi ini bergantung pada data historis dan mungkin tidak bereaksi dengan cepat terhadap peristiwa yang tidak terduga atau fluktuasi pasar yang tidak biasa.
Arah optimasi strategi
- Mengintegrasikan indikator teknis lainnya atau faktor-faktor mendasar untuk memperkaya basis keputusan strategis dan meningkatkan akurasi sinyal.
- Optimalkan pilihan parameter, seperti panjang regresi, kelipatan volatilitas, siklus EMA, dan lain-lain, agar sesuai dengan varietas dan karakteristik pasar yang berbeda.
- Meningkatkan mekanisme stop loss dan stop loss, mengendalikan risiko transaksi tunggal dan tingkat penarikan secara keseluruhan.
- Pertimbangkan untuk memasukkan aturan manajemen posisi dan pengelolaan dana, menyesuaikan ukuran posisi sesuai dengan fluktuasi pasar dan ekuitas akun.
Meringkaskan
Strategi ini mengidentifikasi keadaan pasar melalui indikator regresi linier dan volatilitas, dan menggunakan EMA sebagai indikator konfirmasi, untuk membangun strategi perdagangan yang kuat dan logis. Keunggulan strategi ini adalah menggabungkan tren dan volatilitas, sementara memungkinkan pengoptimalan parameter, yang berlaku untuk berbagai lingkungan pasar. Namun, strategi ini juga memiliki risiko seperti pilihan parameter, pasar goyah dan peristiwa black swan, yang perlu terus dioptimalkan dan disempurnakan di masa depan dalam aplikasi nyata.
- 1