Strategi rata-rata bergerak berdasarkan persilangan rata-rata bergerak ganda

Ringkasan
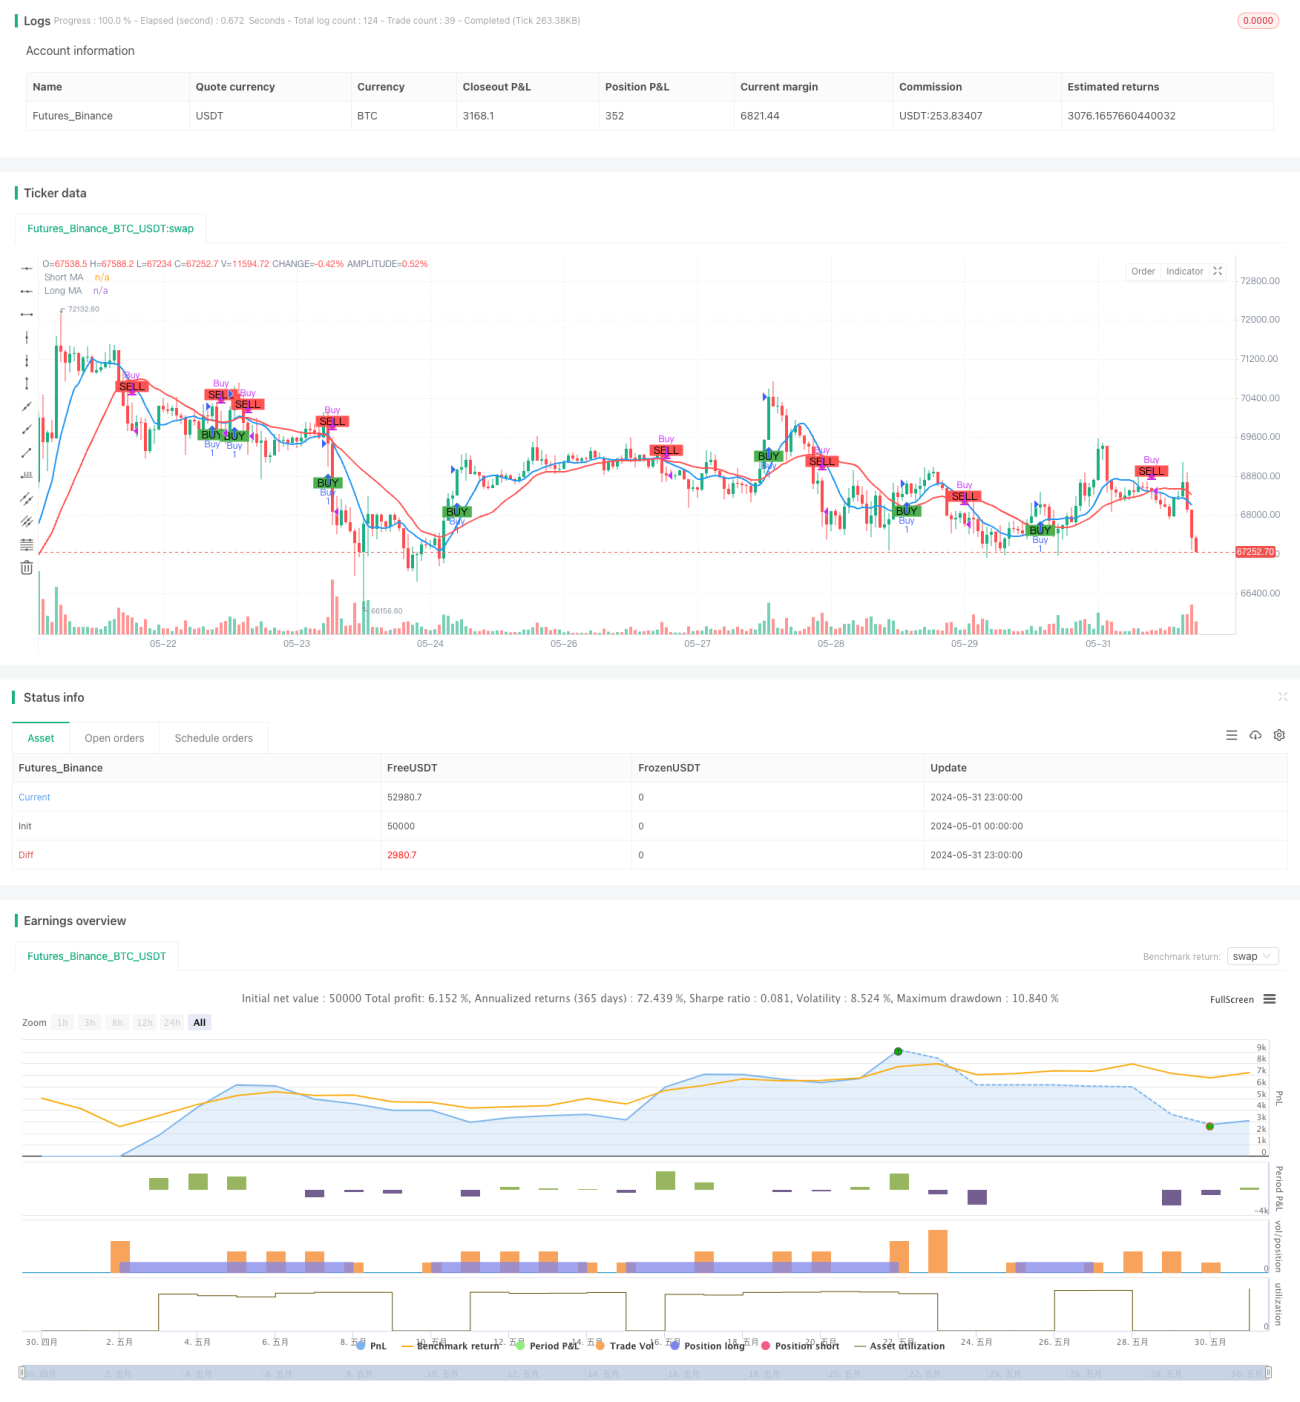
Strategi moving average yang didasarkan pada crossover dua rata-rata adalah metode perdagangan intraday yang sederhana dan efektif yang bertujuan untuk mengidentifikasi peluang jual beli potensial di pasar dengan menganalisis hubungan antara dua rata-rata bergerak yang berbeda. Strategi ini menggunakan satu rata-rata bergerak sederhana jangka pendek (SMA) dan satu rata-rata bergerak sederhana jangka panjang.
Prinsip Strategi
Prinsip inti dari strategi ini adalah memanfaatkan karakteristik tren dan keterlambatan rata-rata bergerak periode yang berbeda, menilai arah tren pasar saat ini dengan membandingkan rata-rata jangka pendek dengan rata-rata jangka panjang, sehingga dapat membuat keputusan perdagangan yang sesuai. Ketika pasar mengalami tren naik, harga akan menembus rata-rata jangka panjang, rata-rata jangka pendek kemudian menembus rata-rata jangka panjang membentuk garpu emas, menghasilkan sinyal beli; ketika pasar mengalami tren turun, harga akan menembus rata-rata jangka panjang, rata-rata jangka pendek kemudian menembus rata-rata jangka panjang membentuk garpu mati, menghasilkan sinyal jual.
Keunggulan Strategis
- Sederhana dan mudah dipahami: Strategi ini didasarkan pada teori rata-rata bergerak klasik, logikanya jelas, mudah dipahami dan diterapkan.
- Adaptabilitas: Strategi ini dapat diterapkan di beberapa pasar dan varietas perdagangan yang berbeda, dengan menyesuaikan pengaturan parameter, dapat secara fleksibel menanggapi karakteristik pasar yang berbeda.
- Capture Trends: Mengetahui arah tren dengan cara mengintersect dua garis sejajar, membantu trader mengikuti tren utama dengan tepat waktu dan meningkatkan peluang keuntungan.
- Kendali risiko: Strategi ini memperkenalkan konsep manajemen risiko, dengan pengaturan posisi untuk mengendalikan risiko setiap transaksi, secara efektif mengelola potensi kerugian.
- Mengurangi kebisingan: Menggunakan karakteristik keterlambatan garis rata-rata, secara efektif menyaring kebisingan acak di pasar, meningkatkan keandalan sinyal perdagangan.
Risiko Strategis
- Pemilihan parameter: pengaturan parameter yang berbeda dapat memiliki dampak penting pada kinerja strategi, dan pilihan yang salah dapat menyebabkan kegagalan atau kinerja yang buruk dari strategi.
- Tren pasar: Strategi ini mungkin mengalami kerugian berturut-turut di pasar yang bergoyang atau di titik-titik perubahan tren.
- Biaya Slip-Point: Sering bertransaksi dapat menghasilkan biaya slip-point yang lebih tinggi, yang mempengaruhi keuntungan keseluruhan dari strategi tersebut.
- Black Swan Incident: Strategi ini tidak dapat disesuaikan dengan situasi ekstrem, dan Black Swan Incident dapat menyebabkan kerugian besar bagi strategi tersebut.
- Risiko overfit: Jika optimasi parameter terlalu bergantung pada data historis, strategi dapat menyebabkan kinerja yang buruk dalam perdagangan aktual.
Arah optimasi strategi
- Optimasi parameter dinamis: menyesuaikan parameter strategi secara dinamis sesuai dengan perubahan kondisi pasar, meningkatkan fleksibilitas.
- Konfirmasi tren: Setelah menghasilkan sinyal perdagangan, memperkenalkan indikator lain atau pola perilaku harga untuk mengkonfirmasi tren, meningkatkan keandalan sinyal.
- Stop Loss: Memperkenalkan mekanisme stop loss yang masuk akal untuk mengontrol lebih lanjut risiko transaksi tunggal.
- Manajemen posisi: Metode untuk mengoptimalkan penyesuaian posisi, seperti memperkenalkan indikator volatilitas, menyesuaikan posisi secara dinamis sesuai dengan tingkat fluktuasi pasar.
- Evaluasi kekuatan multihead: mengevaluasi hubungan kontras antara kekuatan multihead dan headless, intervensi pada awal tren, meningkatkan akurasi penangkapan tren.
Meringkaskan
Strategi moving average yang didasarkan pada crossover dua rata-rata adalah metode perdagangan harian yang sederhana dan praktis untuk menilai arah tren pasar dan menghasilkan sinyal perdagangan dengan membandingkan hubungan posisi antara rata-rata periode yang berbeda. Strategi ini memiliki logika yang jelas, kemampuan beradaptasi yang kuat, dan dapat secara efektif menangkap tren pasar, sambil memperkenalkan langkah-langkah manajemen risiko untuk mengendalikan potensi kerugian. Namun, strategi ini juga memiliki risiko potensial seperti parameter, memilih pergeseran tren, dan perdagangan yang sering.
Overview
The Moving Average Crossover Strategy based on dual moving averages is a straightforward and effective intraday trading approach designed to identify potential buy and sell opportunities in the market by analyzing the relationship between two moving averages of different periods. This strategy utilizes a short-term simple moving average (SMA) and a long-term simple moving average. When the short-term moving average crosses above the long-term moving average, it indicates a bullish signal, suggesting a potential buying opportunity. Conversely, when the short-term moving average crosses below the long-term moving average, it indicates a bearish signal, suggesting a potential selling opportunity. This crossover method helps traders capture trending moves in the market while minimizing market noise interference.
Strategy Principle
The core principle of this strategy is to utilize the trend characteristics and lag of moving averages with different periods. By comparing the relative position relationship between the short-term moving average and the long-term moving average, it determines the current market trend direction and makes corresponding trading decisions. When an upward trend emerges in the market, the price will first break through the long-term moving average, and the short-term moving average will subsequently cross above the long-term moving average, forming a golden cross and generating a buy signal. When a downward trend emerges in the market, the price will first break below the long-term moving average, and the short-term moving average will subsequently cross below the long-term moving average, forming a death cross and generating a sell signal. In the parameter settings of this strategy, the period of the short-term moving average is set to 9, and the period of the long-term moving average is set to 21. These two parameters can be adjusted based on market characteristics and personal preferences. Additionally, this strategy introduces the concept of money management by setting the initial capital and risk percentage per trade, using position sizing to control the risk exposure of each trade.
Strategy Advantages
- Simplicity: This strategy is based on the classic moving average theory, with clear logic and easy to understand and implement.
- Adaptability: This strategy can be applied to multiple markets and different trading instruments. By adjusting parameter settings, it can flexibly adapt to different market characteristics.
- Trend Capture: By using the dual moving average crossover to determine the trend direction, it helps traders timely follow the mainstream trend and increase profit opportunities.
- Risk Control: This strategy introduces the concept of risk management, using position sizing to control the risk exposure of each trade, effectively managing potential losses.
- Noise Reduction: By utilizing the lag characteristic of moving averages, it effectively filters out random noise in the market, improving the reliability of trading signals.
Strategy Risks
- Parameter Selection: Different parameter settings can have a significant impact on strategy performance. Improper selection may lead to strategy failure or poor performance.
- Market Trend: In ranging markets or trend turning points, this strategy may experience consecutive losses.
- Slippage Costs: Frequent trading may result in higher slippage costs, affecting the overall profitability of the strategy.
- Black Swan Events: This strategy has poor adaptability to extreme market conditions, and black swan events may cause significant losses to the strategy.
- Overfitting Risk: If parameter optimization relies too heavily on historical data, it may lead to poor performance of the strategy in actual trading.
Strategy Optimization Directions
- Dynamic Parameter Optimization: Dynamically adjust strategy parameters based on changes in market conditions to improve adaptability.
- Trend Confirmation: After generating trading signals, introduce other indicators or price behavior patterns to confirm the trend, improving signal reliability.
- Stop-Loss and Take-Profit: Introduce reasonable stop-loss and take-profit mechanisms to further control the risk exposure of each trade.
- Position Management: Optimize the position sizing method, such as introducing volatility indicators to dynamically adjust positions based on market volatility levels.
- Long-Short Strength Assessment: Assess the comparative relationship between bullish and bearish strengths, entering at the early stage of a trend to improve the accuracy of trend capture.
Summary
The Moving Average Crossover Strategy based on dual moving averages is a simple and practical intraday trading method. By comparing the position relationship of moving averages with different periods, it determines the market trend direction and generates trading signals. This strategy has clear logic, strong adaptability, and can effectively capture market trends while introducing risk management measures to control potential losses. However, this strategy also has potential risks such as parameter selection, trend reversal, frequent trading, etc. It needs to be further improved through dynamic optimization, signal confirmation, position management, and other methods to enhance the robustness and profitability of the strategy. In general, as a classic technical analysis indicator, the basic principles and practical application value of moving averages have been widely verified by the market. It is a trading strategy worthy of in-depth research and continuous optimization.
- 1