Strategi perdagangan VWAP dan pemantauan anomali volume

VWAP RSI YTD SMA
Tanggal Pembuatan: 2024-06-07 15:44:04 Akhirnya memodifikasi: 2024-06-07 15:44:04
menyalin: 0 Jumlah klik: 717
1
fokus pada
1617
Pengikut

Strategi perdagangan VWAP dan pemantauan anomali volume

Ringkasan

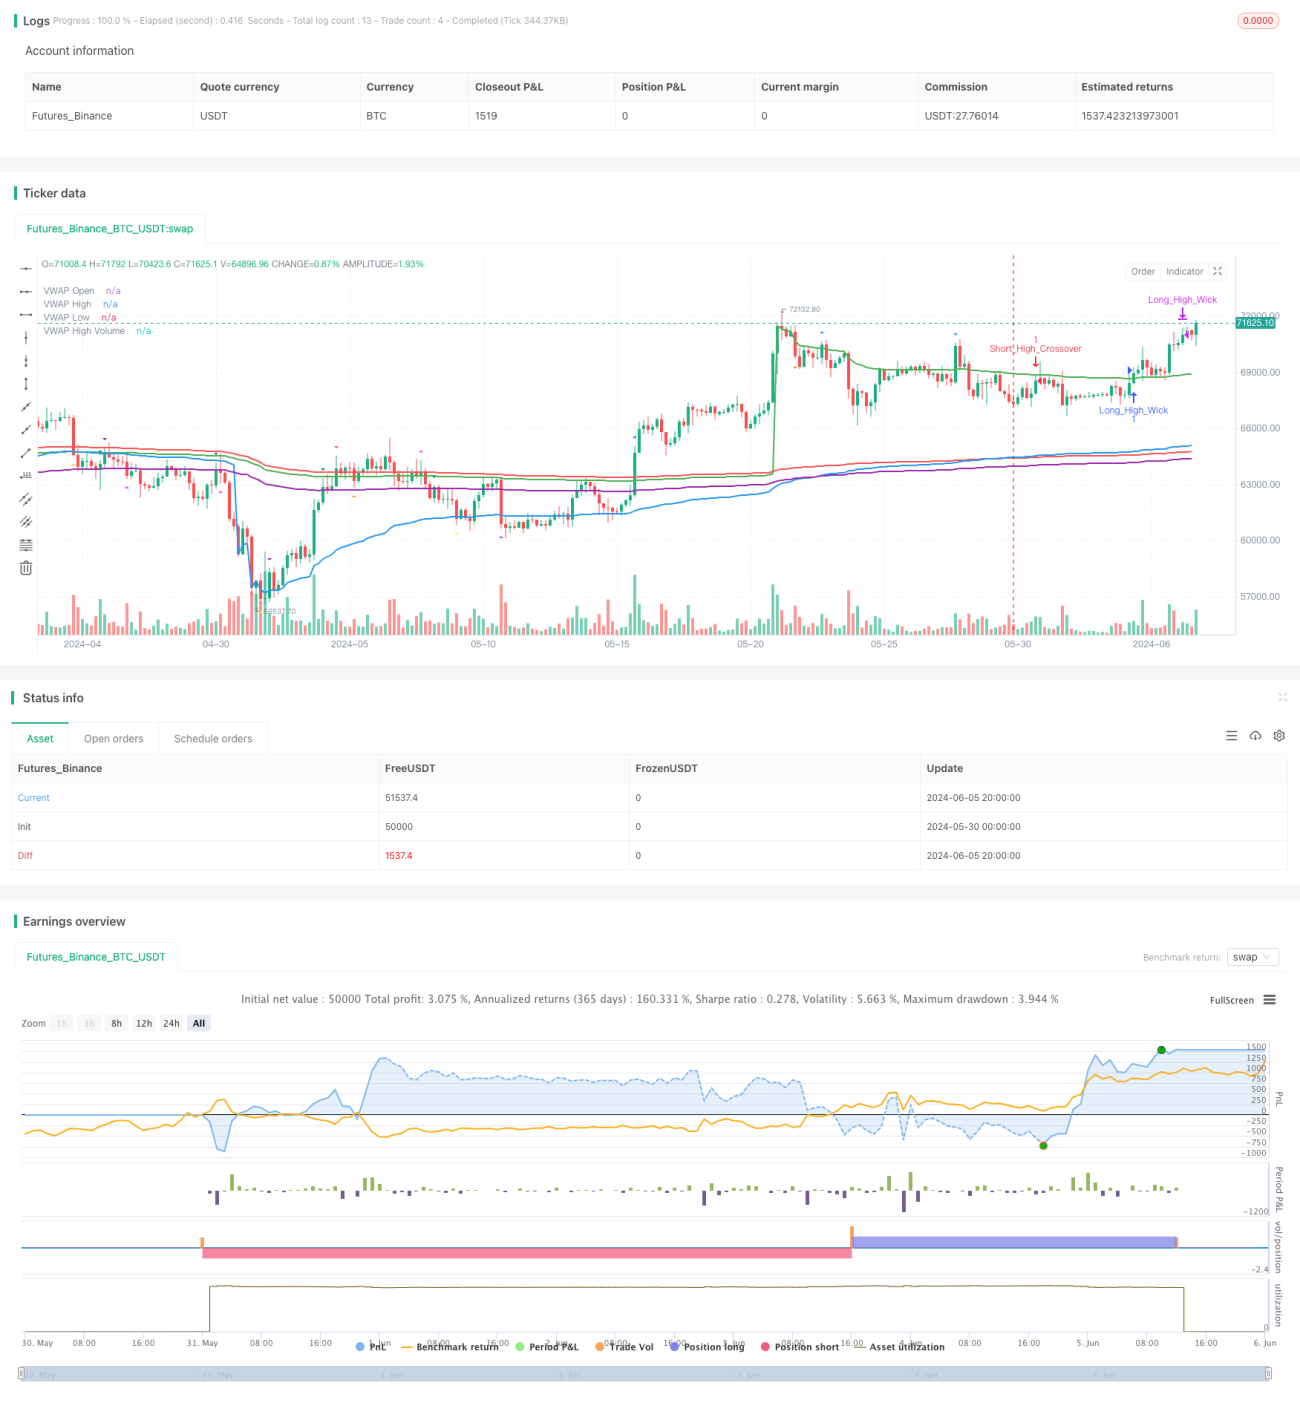
Strategi ini didasarkan pada beberapa tingkat VWAP (volume-weighted average price) yang terdiri dari grafik VWAP dengan harga buka, harga tertinggi, harga terendah, dan volume transaksi yang luar biasa tinggi. Strategi ini menggunakan VWAP sebagai titik dukungan dan titik perlawanan, sambil mempertimbangkan keadaan luar biasa dalam volume transaksi. Strategi ini menghasilkan sinyal perdagangan ketika harga melampaui level VWAP dan memenuhi kondisi tertentu.

Prinsip Strategi

  1. Hitung beberapa tingkat VWAP, termasuk VWAP harga buka, VWAP harga tertinggi, VWAP harga terendah, dan VWAP dengan grafik volume transaksi yang sangat tinggi.
  2. Untuk mendeteksi peta lalu lintas yang luar biasa tinggi, dan menempatkan kembali variabel akumulatif VWAP yang luar biasa tinggi pada peta tersebut.
  3. Set deviasi di atas dan di bawah tingkat VWAP sebagai kondisi pemicu sinyal perdagangan.
  4. Periksa apakah ada harga di sisi lain dari VWAP untuk menghindari sinyal yang salah.
  5. Berdasarkan posisi harga relatif terhadap VWAP dan hubungan antara harga close out dan open out, menghasilkan beberapa sinyal trading, termasuk dua jenis Wick ((shadow line) dan Crossover ((crossover)).
  6. Menggunakan indikator RSI untuk mendeteksi perubahan momentum, ketika RSI lebih dari 70 atau lebih rendah dari 30, perdagangan yang sesuai dengan posisi kosong.

Analisis Keunggulan

  1. Strategi ini memanfaatkan beberapa tingkat VWAP untuk memberikan informasi yang lebih komprehensif tentang titik dukungan dan resistance.
  2. Strategi ini dapat menangkap perubahan penting di pasar dengan mendeteksi peta lalu lintas yang sangat tinggi.
  3. Pengaturan deviasi dapat memfilter beberapa sinyal noise dan meningkatkan kualitas sinyal perdagangan.
  4. Dengan mempertimbangkan harga yang melonjak di sisi lain VWAP, beberapa sinyal yang salah dihindari.
  5. Ada beberapa sinyal perdagangan yang dihasilkan berdasarkan posisi harga relatif terhadap VWAP dan hubungan antara harga penutupan dan harga pembukaan, meningkatkan fleksibilitas strategi.
  6. Menggunakan indikator RSI sebagai kondisi posisi rata dapat membantu strategi untuk keluar dari perdagangan tepat waktu ketika terjadi perubahan momentum.

Analisis risiko

  1. Strategi ini bergantung pada tingkat VWAP, yang dapat hilang jika terjadi situasi ekstrem di pasar.
  2. Pertimbangan volume transaksi yang luar biasa didasarkan pada nilai terendah yang tetap dan mungkin tidak dapat disesuaikan dengan situasi pasar yang berbeda.
  3. Pengaturan nilai deviasi mungkin perlu disesuaikan dengan pasar dan varietas perdagangan yang berbeda.
  4. Strategi ini menghasilkan beberapa sinyal perdagangan yang dapat menyebabkan overtrading dan biaya transaksi yang tinggi.
  5. RSI dapat menghasilkan sinyal posisi tertunda, yang menyebabkan strategi menanggung risiko yang lebih besar.

Arah optimasi

  1. Optimalkan metode perhitungan tingkat VWAP, seperti mempertimbangkan periode waktu yang lebih lama atau menggunakan metode bobot.
  2. Mengoptimalkan kriteria untuk menilai volume transaksi yang luar biasa tinggi, seperti dengan menggunakan ambang batas yang disesuaikan atau dikombinasikan dengan indikator volume transaksi lainnya.
  3. Optimalisasi parameter untuk nilai deviasi untuk menemukan amplitudo deviasi yang optimal.
  4. Memperkenalkan langkah-langkah manajemen risiko, seperti pengaturan stop loss dan stop-loss, untuk mengontrol risiko pada transaksi tunggal.
  5. Cobalah indikator momentum lainnya atau kombinasi dari beberapa indikator untuk mendapatkan sinyal posisi yang lebih akurat.
  6. Filter sinyal trading untuk mengurangi overtrading dan mengurangi biaya transaksi.

Meringkaskan

Strategi ini menggunakan beberapa tingkat VWAP dan deteksi abnormalitas volume transaksi untuk menghasilkan sinyal perdagangan yang beragam. Dengan mempertimbangkan posisi relatif harga dan VWAP, hubungan harga penutupan dengan harga pembukaan, dan indikator RSI, strategi ini mencoba untuk menangkap perubahan penting di pasar dan keluar dari perdagangan pada waktu yang tepat. Namun, strategi ini juga memiliki beberapa risiko, seperti adaptasi terhadap situasi ekstrem, overtrading, dan sinyal posisi terlambat.

Kode Sumber Strategi
/*backtest
start: 2024-05-30 00:00:00
end: 2024-06-06 00:00:00
period: 4h
basePeriod: 15m
exchanges: [{"eid":"Futures_Binance","currency":"BTC_USDT"}]
*/

//@version=5
strategy("5 Anchored VWAP Strategy with Abnormally High Volume Candle", overlay=true)

// Initialize VWAP variables
var float vwap_open = na
var float vwap_high = na
var float vwap_low = na
var float vwap_high_volume = na

var float cum_v_open = 0
var float cum_v_high = 0
var float cum_v_low = 0
var float cum_v_high_volume = 0

var float cum_pv_open = 0
var float cum_pv_high = 0
var float cum_pv_low = 0
var float cum_pv_high_volume = 0

var float highest_volume = 0

// Initialize YTD high and low variables
var float ytd_high = na
var float ytd_low = na

// Parameters for abnormal volume detection
length = 20
volume_threshold = 2.0

// Displacement parameters
displacement_percentage = 0.01 // 1% displacement

// Calculate average volume
avg_volume = ta.sma(volume, length)

// Check if it's the first day of the year
is_first_day_of_year = year(time) != year(time[1])

// Reset YTD high and low on the first day of the year
if is_first_day_of_year
    ytd_high := high
    ytd_low := low

// Update YTD high and low
ytd_high := na(ytd_high) ? high : math.max(ytd_high, high)
ytd_low := na(ytd_low) ? low : math.min(ytd_low, low)

// Update cumulative variables for open VWAP
cum_v_open += volume
cum_pv_open += close * volume
if cum_v_open != 0
    vwap_open := cum_pv_open / cum_v_open

// Update cumulative variables for high VWAP
if high == ytd_high
    cum_v_high := 0
    cum_pv_high := 0

cum_v_high += volume
cum_pv_high += close * volume
if cum_v_high != 0
    vwap_high := cum_pv_high / cum_v_high

// Update cumulative variables for low VWAP
if low == ytd_low
    cum_v_low := 0
    cum_pv_low := 0

cum_v_low += volume
cum_pv_low += close * volume
if cum_v_low != 0
    vwap_low := cum_pv_low / cum_v_low

// Check for new high-volume candle that is also abnormally high and reset cumulative variables for high-volume VWAP
new_high_volume = false
if volume > highest_volume and volume > volume_threshold * avg_volume
    highest_volume := volume
    cum_v_high_volume := 0
    cum_pv_high_volume := 0
    new_high_volume := true

cum_v_high_volume += volume
cum_pv_high_volume += close * volume
if cum_v_high_volume != 0
    vwap_high_volume := cum_pv_high_volume / cum_v_high_volume

// Plot VWAPs
plot(vwap_open, color=color.red, linewidth=2, title="VWAP Open")
plot(vwap_high, color=color.green, linewidth=2, title="VWAP High")
plot(vwap_low, color=color.blue, linewidth=2, title="VWAP Low")
plot(vwap_high_volume, color=color.purple, linewidth=2, title="VWAP High Volume")

// Plot a vertical line on the chart only when a new high-volume VWAP anchor occurs
bgcolor(new_high_volume ? color.new(color.purple, 90) : na, offset=-1)

// Calculate displacement amounts
displacement_amount_open = vwap_open * displacement_percentage
displacement_amount_high = vwap_high * displacement_percentage
displacement_amount_low = vwap_low * displacement_percentage
displacement_amount_high_volume = vwap_high_volume * displacement_percentage

// Check for gaps on the opposite side of a VWAP
gap_up_opposite_open = na(close[1]) ? false : (open > close[1] and open < vwap_open and close[1] > vwap_open)
gap_down_opposite_open = na(close[1]) ? false : (open < close[1] and open > vwap_open and close[1] < vwap_open)

gap_up_opposite_high = na(close[1]) ? false : (open > close[1] and open < vwap_high and close[1] > vwap_high)
gap_down_opposite_high = na(close[1]) ? false : (open < close[1] and open > vwap_high and close[1] < vwap_high)

gap_up_opposite_low = na(close[1]) ? false : (open > close[1] and open < vwap_low and close[1] > vwap_low)
gap_down_opposite_low = na(close[1]) ? false : (open < close[1] and open > vwap_low and close[1] < vwap_low)

gap_up_opposite_high_volume = na(close[1]) ? false : (open > close[1] and open < vwap_high_volume and close[1] > vwap_high_volume)
gap_down_opposite_high_volume = na(close[1]) ? false : (open < close[1] and open > vwap_high_volume and close[1] < vwap_high_volume)

// RSI calculation for momentum change detection
rsi = ta.rsi(close, 14)
long_exit_condition = rsi > 70
short_exit_condition = rsi < 30

// Debugging Plots
plotshape(not gap_up_opposite_open and not gap_down_opposite_open and close > vwap_open and low < vwap_open - displacement_amount_open and close[1] < vwap_open, style=shape.triangledown, location=location.abovebar, color=color.red, size=size.small, title="Open Long Signal")
plotshape(not gap_up_opposite_open and not gap_down_opposite_open and close < vwap_open and high > vwap_open + displacement_amount_open and close[1] > vwap_open, style=shape.triangleup, location=location.belowbar, color=color.green, size=size.small, title="Open Short Signal")

plotshape(not gap_up_opposite_high and not gap_down_opposite_high and close > vwap_high and low < vwap_high - displacement_amount_high and close[1] < vwap_high, style=shape.triangledown, location=location.abovebar, color=color.blue, size=size.small, title="High Long Signal")
plotshape(not gap_up_opposite_high and not gap_down_opposite_high and close < vwap_high and high > vwap_high + displacement_amount_high and close[1] > vwap_high, style=shape.triangleup, location=location.belowbar, color=color.orange, size=size.small, title="High Short Signal")

plotshape(not gap_up_opposite_low and not gap_down_opposite_low and close > vwap_low and low < vwap_low - displacement_amount_low and close[1] < vwap_low, style=shape.triangledown, location=location.abovebar, color=color.purple, size=size.small, title="Low Long Signal")
plotshape(not gap_up_opposite_low and not gap_down_opposite_low and close < vwap_low and high > vwap_low + displacement_amount_low and close[1] > vwap_low, style=shape.triangleup, location=location.belowbar, color=color.yellow, size=size.small, title="Low Short Signal")

plotshape(not gap_up_opposite_high_volume and not gap_down_opposite_high_volume and close > vwap_high_volume and low < vwap_high_volume - displacement_amount_high_volume and close[1] < vwap_high_volume, style=shape.triangledown, location=location.abovebar, color=color.teal, size=size.small, title="High Volume Long Signal")
plotshape(not gap_up_opposite_high_volume and not gap_down_opposite_high_volume and close < vwap_high_volume and high > vwap_high_volume + displacement_amount_high_volume and close[1] > vwap_high_volume, style=shape.triangleup, location=location.belowbar, color=color.fuchsia, size=size.small, title="High Volume Short Signal")

// Trading signals based on VWAP support/resistance with displacement, no gaps on the opposite side, and bounce conditions
if not gap_up_opposite_open and not gap_down_opposite_open
    if (close > vwap_open and low < vwap_open)
        if close > open
            strategy.entry("Long_Open_Wick", strategy.long, comment="Wick")
        else
            strategy.entry("Long_Open_Crossover", strategy.long, comment="Crossover")
    
    if (close < vwap_open and high > vwap_open)
        if close < open
            strategy.entry("Short_Open_Wick", strategy.short, comment="Wick")
        else
            strategy.entry("Short_Open_Crossover", strategy.short, comment="Crossover")

if not gap_up_opposite_high and not gap_down_opposite_high
    if (close > vwap_high and low < vwap_high)
        if close > open
            strategy.entry("Long_High_Wick", strategy.long, comment="Wick")
        else
            strategy.entry("Long_High_Crossover", strategy.long, comment="Crossover")
    
    if (close < vwap_high and high > vwap_high)
        if close < open
            strategy.entry("Short_High_Wick", strategy.short, comment="Wick")
        else
            strategy.entry("Short_High_Crossover", strategy.short, comment="Crossover")

if not gap_up_opposite_low and not gap_down_opposite_low
    if (close > vwap_low and low < vwap_low)
        if close > open
            strategy.entry("Long_Low_Wick", strategy.long, comment="Wick")
        else
            strategy.entry("Long_Low_Crossover", strategy.long, comment="Crossover")
    
    if (close < vwap_low and high > vwap_low)
        if close < open
            strategy.entry("Short_Low_Wick", strategy.short, comment="Wick")
        else
            strategy.entry("Short_Low_Crossover", strategy.short, comment="Crossover")

if not gap_up_opposite_high_volume and not gap_down_opposite_high_volume
    if (close > vwap_high_volume and low < vwap_high_volume)
        if close > open
            strategy.entry("Long_High_Volume_Wick", strategy.long, comment="Wick")
        else
            strategy.entry("Long_High_Volume_Crossover", strategy.long, comment="Crossover")
    
    if (close < vwap_high_volume and high > vwap_high_volume)
        if close < open
            strategy.entry("Short_High_Volume_Wick", strategy.short, comment="Wick")
        else
            strategy.entry("Short_High_Volume_Crossover", strategy.short, comment="Crossover")

// Exit trades based on RSI momentum change
if strategy.position_size > 0 and long_exit_condition
    strategy.close("Long_Open_Wick")
    strategy.close("Long_Open_Crossover")
    strategy.close("Long_High_Wick")
    strategy.close("Long_High_Crossover")
    strategy.close("Long_Low_Wick")
    strategy.close("Long_Low_Crossover")
    strategy.close("Long_High_Volume_Wick")
    strategy.close("Long_High_Volume_Crossover")

if strategy.position_size < 0 and short_exit_condition
    strategy.close("Short_Open_Wick")
    strategy.close("Short_Open_Crossover")
    strategy.close("Short_High_Wick")
    strategy.close("Short_High_Crossover")
    strategy.close("Short_Low_Wick")
    strategy.close("Short_Low_Crossover")
    strategy.close("Short_High_Volume_Wick")
    strategy.close("Short_High_Volume_Crossover")