Strategi Pembalikan Pin Bar yang Difilter Tren

Ringkasan
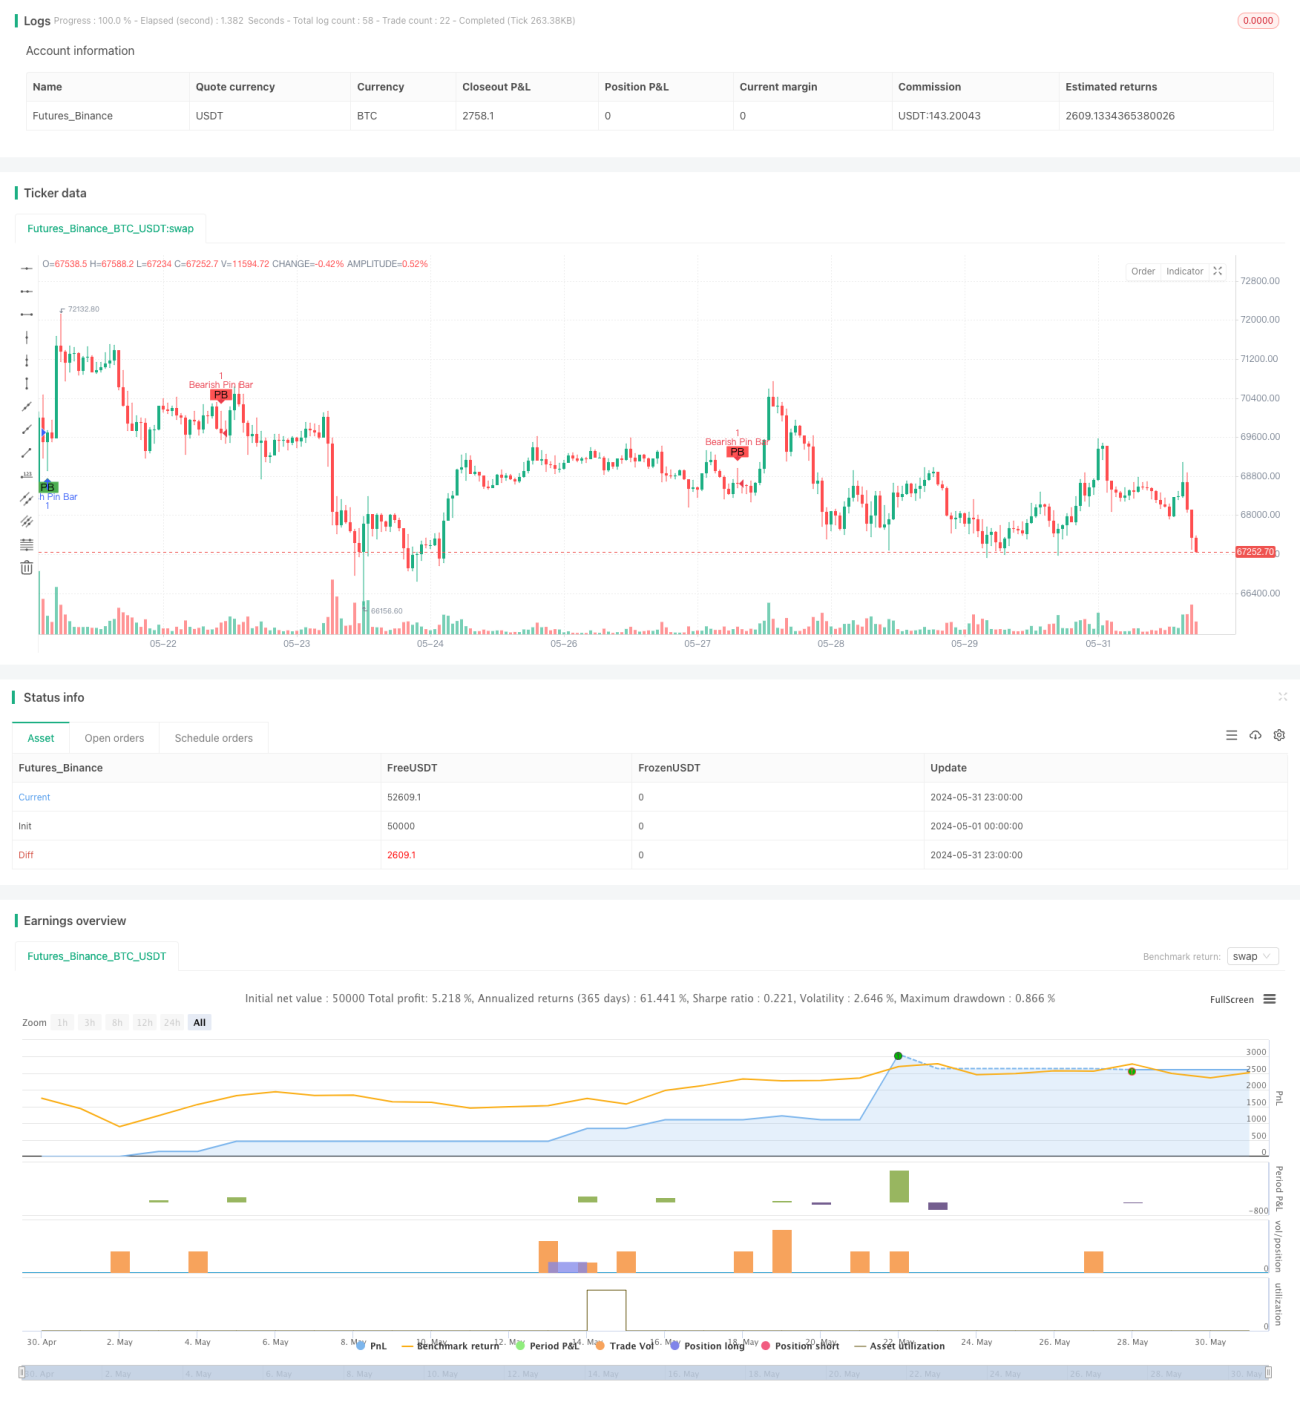
Strategi ini digunakan untuk menentukan arah tren saat ini dengan menggunakan 50 siklus SMA untuk menentukan arah tren, dan menggunakan 20 siklus SMA sebagai kondisi penyaringan volume transaksi yang hanya dianggap sebagai sinyal yang efektif jika volume transaksi lebih besar dari garis rata-rata saat munculnya Pin Bar. Selain itu, strategi ini juga menghitung indikator relatif kuat dan lemah (RSI), tetapi tidak digunakan secara langsung dalam kondisi masuk dan keluar, tetapi dipilih sebagai kondisi untuk sinyal yang dapat ditargetkan lebih lanjut.
Prinsip Strategi
- Pertama-tama, menilai garis atas dan bawah Pin Bar dan ukuran relatif dari entitas, yang mengharuskan garis atas atau bawah untuk setidaknya 60 persen dari seluruh K garis tinggi dan rendah, sedangkan bagian entitas tidak boleh lebih dari 30 persen.
- Penentuan apakah Pin Bar adalah bullish atau bearish dilakukan dengan membandingkan ukuran harga close dan open.
- Menggunakan 50 siklus SMA untuk menilai tren saat ini, ketika harga close out di atas SMA dianggap sebagai tren naik, sebaliknya sebagai tren turun.
- Dengan 20 siklus volume transaksi SMA sebagai threshold dari kondisi volume transaksi filter, hanya volume transaksi yang lebih besar dari nilai ini ketika Pin Bar terwujud yang dianggap sebagai sinyal yang efektif.
- Tentukan indikator harga yang diidentifikasi Pin Bar.
- Buka posisi overhead saat muncul Pin Bar, buka posisi kosong saat muncul Pin Bar.
- Stop loss diatur 2 kali ukuran entitas Pin Bar, dan stop loss diatur 3 kali. Stop loss multihead berada di bawah titik terendah Pin Bar, dan stop loss berada di atas titik tertinggi; dan sebaliknya.
Analisis Keunggulan
- Pin Bar adalah bentuk harga yang sangat intuitif dan efektif yang dapat menangkap perubahan sentimen pasar dengan lebih akurat.
- Kondisi penyaringan tren dapat memastikan bahwa sinyal Pin Bar sesuai dengan arah tren saat ini, yang sangat meningkatkan kemenangan sinyal.
- Kondisi volume transaksi dapat menyaring kebisingan pasar yang disebabkan oleh kurangnya likuiditas, dan memastikan bahwa sinyal Pin Bar memiliki keterlibatan pasar yang cukup.
- Pengaturan posisi stop loss dan stop stop adalah berdasarkan pada karakteristik Pin Bar itu sendiri, dengan risiko dan keuntungan yang wajar.
- Kode logis dan aturan yang jelas, mudah dipahami dan diterapkan.
Analisis risiko
- Keandalan sinyal Pin Bar akan mengalami penurunan besar di pasar yang bergejolak, di mana penyaringan tren tidak terlalu berpengaruh.
- Pin Bar juga bisa rusak jika terjadi insiden dengan pesawat terbang Italia atau Lido.
- "Kalau tidak, kita tidak akan bisa melihat apa yang terjadi", kata dia.
- Untuk varietas dan siklus tertentu, parameter default mungkin perlu dioptimalkan lebih lanjut.
- Sistem sinyal tunggal secara keseluruhan berisiko lebih besar.
Arah optimasi
- Selain itu, dapat dipertimbangkan untuk memperkenalkan bentuk pembalikan lainnya seperti internal Bar untuk memperkaya sumber sinyal.
- Posisi stop loss dan stop loss dapat disesuaikan secara dinamis dengan indikator volatilitas seperti ATR untuk menyesuaikan dengan kondisi pasar yang berbeda.
- Anda bisa menanam padi dengan cara menelusuri persentase dari kerugian.
- Anda dapat menambahkan lebih banyak data mendasar seperti kalender ekonomi dan peristiwa besar untuk memfilter sinyal yang mungkin gagal.
- Pertimbangkan untuk memperkenalkan modul pengelolaan dana untuk mengontrol risiko setiap transaksi.
Meringkaskan
Strategi pembalikan pin bar menggunakan ide yang sederhana dan efektif untuk meningkatkan akurasi pengenalan sinyal melalui pemfilteran tren, pemfilteran volume transaksi, dan sebagainya. Meskipun ada beberapa tempat yang dapat ditingkatkan saat ini, ide keseluruhan adalah layak dan layak untuk diuji lebih lanjut. Pin bar sendiri sebagai bentuk harga klasik, dapat juga digunakan dalam kombinasi dengan indikator atau sinyal lainnya untuk mendapatkan sistem perdagangan yang lebih kuat.
- 1