Strategi Tren RSI

Ringkasan
Strategi ini didasarkan pada indikator RSI yang relatif kuat dan lemah, untuk menentukan sinyal beli dan jual dengan menilai apakah nilai indikator RSI melebihi batas atas dan bawah yang ditentukan. Strategi ini juga menetapkan batas waktu stop loss dan posisi untuk mengendalikan risiko.
Prinsip Strategi
- Menghitung nilai RSI.
- Sinyal beli dihasilkan ketika RSI berada di bawah ambang batas beli yang ditetapkan; sinyal jual dihasilkan ketika RSI berada di atas ambang batas beli yang ditetapkan.
- Menggunakan sinyal beli, jumlah beli dihitung dengan harga penutupan saat ini, dan pesanan beli.
- Jika Anda memiliki stop loss ratio, hitunglah harga stop loss dan pesanlah stop loss.
- Semua pemegang posisi di posisi kosong berdasarkan sinyal jual atau kondisi stop loss.
- Jika Anda mengatur waktu maksimum untuk memegang posisi, maka setelah waktu memegang posisi melebihi waktu maksimum untuk memegang posisi, semua posisi akan dihapus, terlepas dari keuntungan atau kerugian.
Keunggulan Strategis
- RSI adalah indikator analisis teknis yang digunakan secara luas, yang secara efektif menangkap sinyal overbought dan oversold di pasar.
- Strategi ini memperkenalkan stop loss dan batas waktu untuk memegang posisi, yang membantu mengendalikan risiko.
- Strategi logis yang jelas, mudah dipahami dan diterapkan.
- RSI dapat disesuaikan dengan kondisi pasar yang berbeda dengan menyesuaikan parameter dan threshold.
Risiko Strategis
- RSI dalam beberapa kasus dapat memberikan sinyal yang salah, yang menyebabkan kerugian pada strategi.
- Strategi ini tidak mempertimbangkan faktor-faktor mendasar dari varietas yang diperdagangkan, dan hanya mengandalkan indikator teknis, yang mungkin menghadapi risiko terjadinya kejadian pasar yang tidak terduga.
- Rasio stop loss tetap mungkin tidak dapat beradaptasi dengan perubahan volatilitas pasar.
- Kinerja kebijakan dapat dipengaruhi oleh pengaturan parameter, parameter yang tidak tepat dapat menyebabkan kinerja kebijakan yang buruk.
Arah optimasi strategi
- Memperkenalkan indikator teknis lainnya, seperti moving averages, untuk meningkatkan keandalan strategi.
- Optimalkan strategi stop loss, seperti stop loss bergerak atau stop loss dinamis berdasarkan volatilitas.
- Parameter RSI dan thresholds disesuaikan secara dinamis dengan kondisi pasar.
- Menggabungkan analisis fundamental dari varietas perdagangan untuk meningkatkan kemampuan strategi untuk mengontrol risiko.
- Retest dan optimasi parameter untuk menemukan kombinasi parameter yang optimal.
Meringkaskan
Strategi ini memanfaatkan indikator RSI untuk menangkap sinyal overbought dan oversold di pasar, dan memperkenalkan batasan waktu stop loss dan hold untuk mengendalikan risiko. Logika strategi sederhana, mudah diterapkan dan dioptimalkan. Namun, kinerja strategi dapat dipengaruhi oleh fluktuasi pasar dan pengaturan parameter, sehingga perlu digabungkan dengan metode analisis dan manajemen risiko lainnya untuk meningkatkan kehandalan dan profitabilitas strategi.
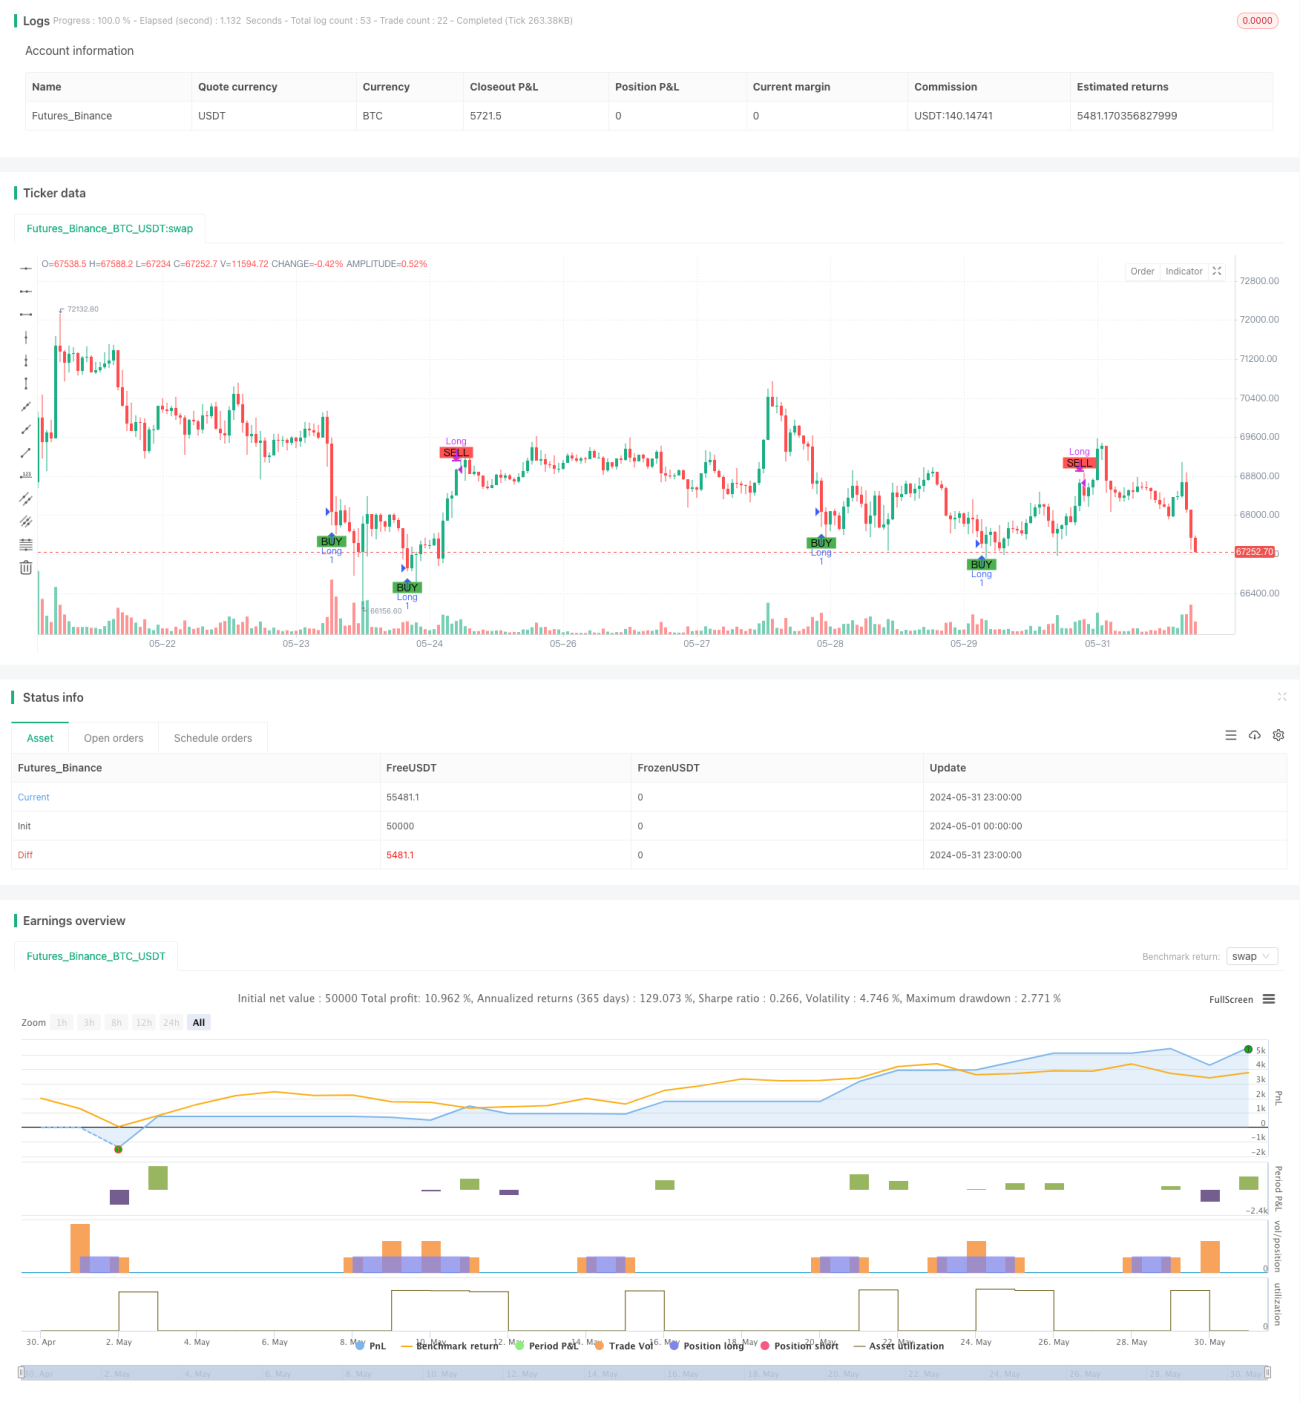
/*backtest
start: 2024-05-01 00:00:00
end: 2024-05-31 23:59:59
period: 1h
basePeriod: 15m
exchanges: [{"eid":"Futures_Binance","currency":"BTC_USDT"}]
*/

//@version=5
strategy("Simple RSI Strategy", overlay=true,  initial_capital=20, commission_value=0.1, commission_type=strategy.commission.percent)

// Define the hardcoded date (Year, Month, Day, Hour, Minute)- 1