Strategi perdagangan stop-profit dan stop-loss dinamis EMA RSI MACD

Ringkasan
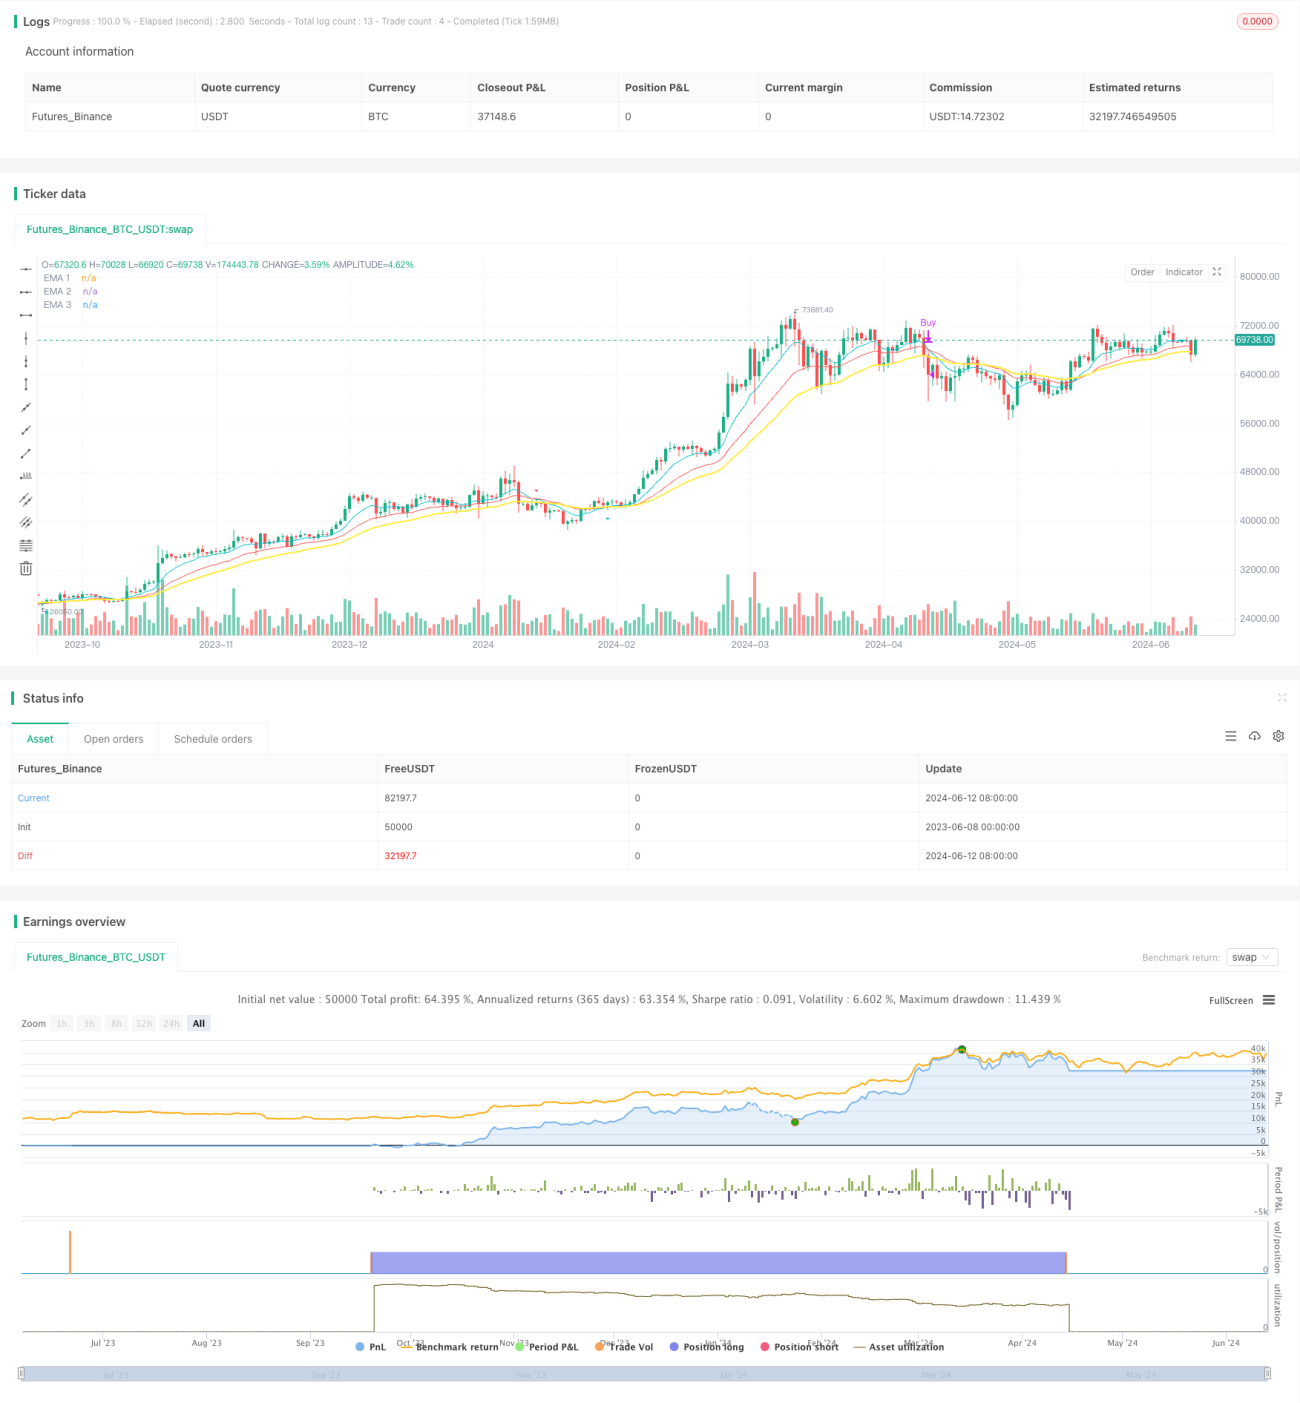
Strategi perdagangan ini menggabungkan tiga indikator teknis, yaitu indeks moving average (EMA), relative strength index (RSI), dan moving average convergence spread (MACD), untuk menghasilkan sinyal jual beli dengan menganalisis hubungan silang dan numerik mereka ketika harga memenuhi kondisi tertentu. Strategi ini juga mengatur stop and loss dinamis untuk mengelola risiko perdagangan.
Prinsip Strategi
- Menghitung nilai rata-rata harga close-out yang tinggi atau rendah (HLCC4) sebagai data dasar strategi.
- Indikator EMA dan RSI berdasarkan HLCC4 dihitung dalam tiga periode berbeda.
- Hitung nilai dari MACD column diagram.
- Untuk menilai persilangan antara EMA1 dan EMA2:
- Ketika EMA1 memakai EMA2, maka akan menghasilkan sinyal sentuh.
- Ketika EMA1 turun melewati EMA2, maka akan ada sinyal turun.
- Pertimbangan EMA, RSI, dan MACD secara komprehensif untuk menentukan apakah kondisi pembelian atau penjualan terpenuhi:
- Kondisi pembelian: EMA1 dengan EMA2, HLCC4 lebih tinggi dari EMA3, RSI lebih tinggi dari penurunan, harga close out lebih tinggi dari harga open out, MACD pilar positif.
- Kondisi jual: EMA1 di bawah EMA2, HLCC4 di bawah EMA3, RSI di bawah defisit, harga close out di bawah harga open out, MACD pilar negatif.
- Jika ada sinyal sebaliknya saat memegang posisi, tutup posisi sebelumnya dan buka posisi baru.
- Saat membeli atau menjual, atur harga stop stop dan stop loss sesuai dengan jumlah poin yang ditetapkan.
Keunggulan Strategis
- Dengan adanya beberapa indikator teknis untuk penilaian terpadu, meningkatkan keandalan sinyal.
- Dengan adanya mekanisme stop loss yang dinamis, risiko dapat dikendalikan secara efektif.
- Pada saat muncul sinyal sebaliknya, posisi yang ada akan dihapus terlebih dahulu, untuk menghindari masalah pemegang posisi berulang.
- Parameter dapat disesuaikan, beradaptasi, dan dapat dioptimalkan sesuai dengan lingkungan pasar yang berbeda.
Risiko Strategis
- Dalam situasi yang bergejolak, persimpangan yang sering dapat menyebabkan transaksi yang berlebihan dan meningkatkan biaya biaya.
- Stop loss dengan poin tetap mungkin tidak dapat beradaptasi dengan fluktuasi pasar, menyebabkan stop loss terlalu dini atau stop loss terlalu terlambat.
- Strategi ini bergantung pada data historis dan mungkin tidak dapat bereaksi dengan cepat terhadap kejadian atau tindakan yang tidak biasa.
Arah optimasi strategi
- Anda dapat mempertimbangkan untuk memperkenalkan lebih banyak indikator teknis atau indikator sentimen pasar, seperti Brinks, ATR, dan sebagainya, untuk meningkatkan akurasi sinyal.
- Untuk stop loss, Anda dapat menggunakan cara yang lebih dinamis, seperti melacak stop loss atau menyesuaikan jarak stop loss sesuai dengan fluktuasi.
- Ini dapat digabungkan dengan analisis fundamental, seperti berita besar, data ekonomi, dan sebagainya, untuk memfilter sinyal perdagangan dan menghindari perdagangan pada periode khusus.
- Untuk pengaturan parameter, algoritma pembelajaran mesin atau optimasi dapat digunakan untuk mencari kombinasi parameter yang optimal.
Meringkaskan
Strategi ini menggabungkan beberapa indikator teknis seperti EMA, RSI, dan MACD untuk membentuk satu set sistem perdagangan yang lengkap. Dalam situasi yang sedang tren, strategi ini dapat secara efektif menangkap tren dan mengendalikan risiko dengan stop loss yang dinamis. Tetapi dalam situasi yang goyah, perdagangan yang sering dapat mempengaruhi keuntungan.
- 1