Strategi kondisi masuk lanjutan berdasarkan rata-rata pergerakan, dukungan resistensi, dan volume

Ringkasan
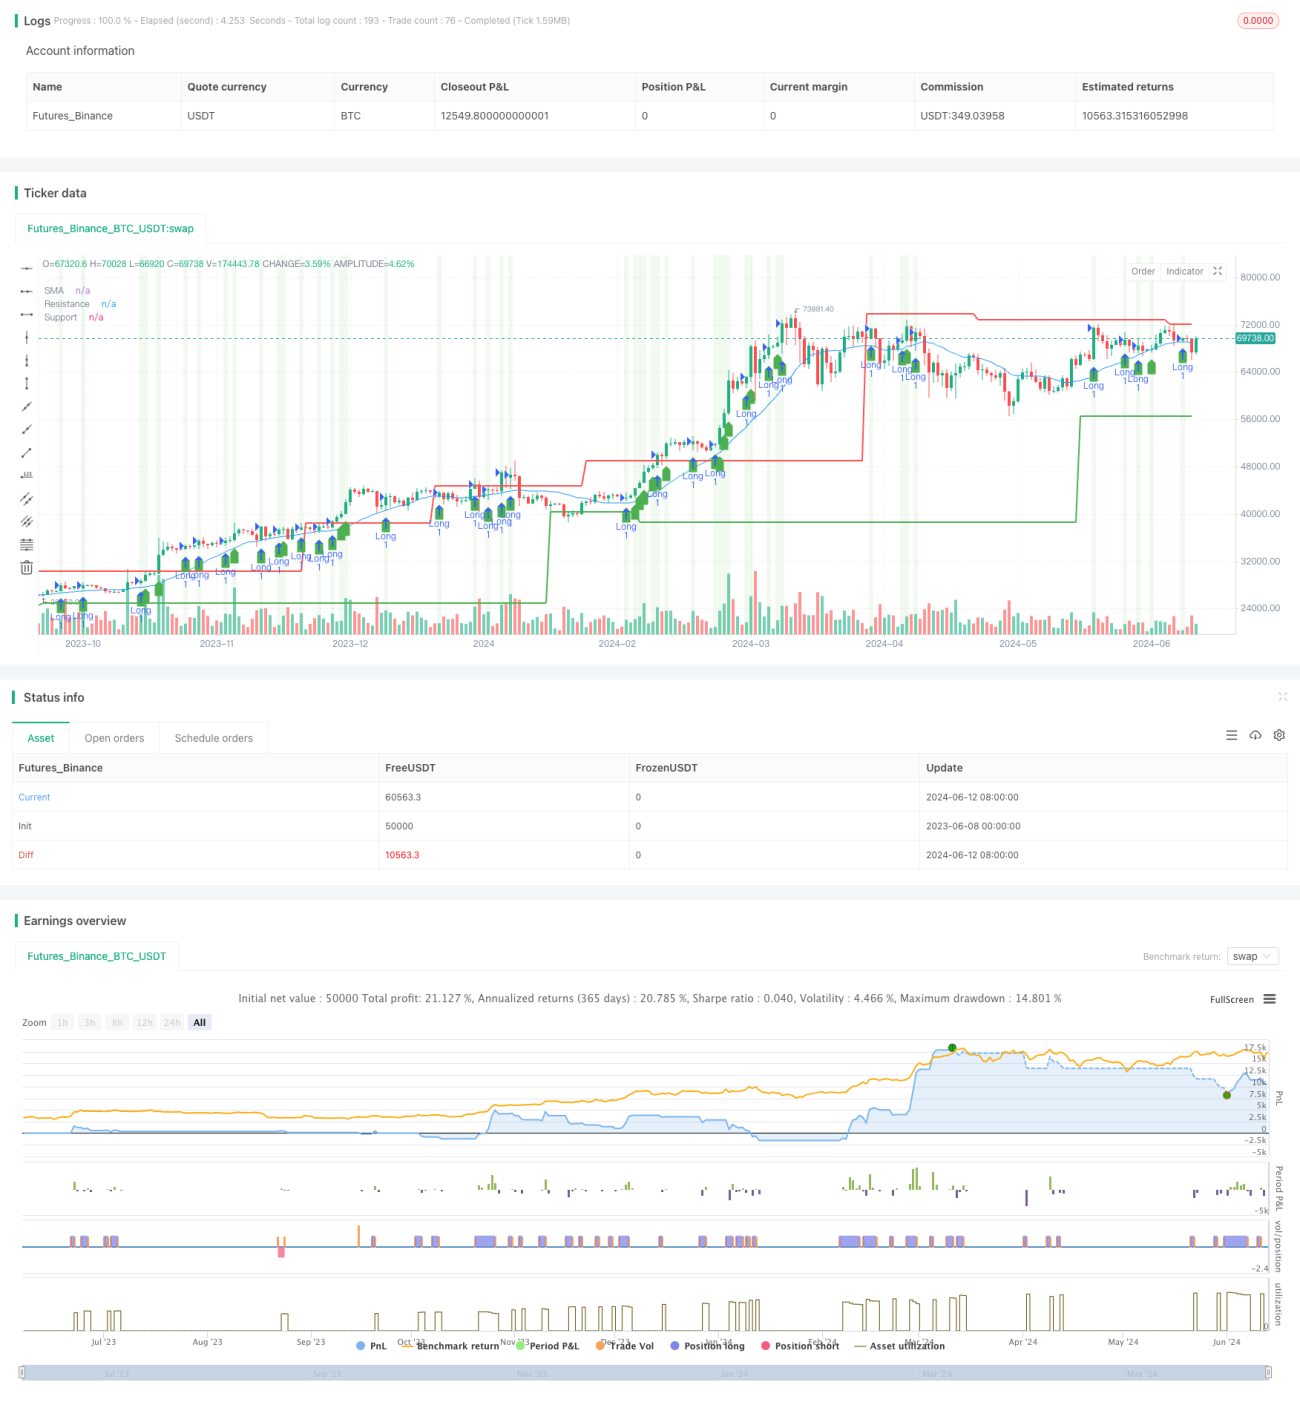
Strategi ini menggabungkan tiga indikator teknis, yaitu Moving Average Simple (SMA), Support Resistance Level (SRL), dan Volume Trading yang meningkat, untuk membangun strategi perdagangan yang komprehensif. Gagasan utama strategi ini adalah untuk melakukan perdagangan ketika harga menembus SMA Average, Support Resistance Level (RSL) dan diikuti dengan peningkatan volume perdagangan, sambil mengatur kondisi stop loss untuk mengendalikan risiko.
Prinsip Strategi
- Menghitung garis rata-rata SMA, titik dukungan dan titik resistensi untuk periode yang ditentukan.
- Periksa apakah volume transaksi saat ini meningkat dibandingkan dengan periode sebelumnya.
- Kondisi masuk multihead: harga penutupan saat ini lebih besar dari harga penutupan periode sebelumnya, dan lebih besar dari garis rata-rata SMA dan dukungan, dan jarak harga dari titik resistensi, dan meningkatnya volume perdagangan.
- Kondisi masuk kosong: harga penutupan saat ini lebih kecil dari harga penutupan periode sebelumnya, dan lebih kecil dari garis rata-rata SMA dan level dukungan, sementara harga berada pada jarak tertentu dari titik resistensi, dan meningkat seiring dengan volume perdagangan.
- Kondisi stop loss: harga stop loss multiply dengan harga masuk (((1-persen stop loss), harga stop loss kosong multiply dengan harga masuk (((1+persen stop loss))
Analisis Keunggulan
- Dengan menggabungkan beberapa indikator teknis, strategi ini meningkatkan keandalan dan stabilitas.
- Selain itu, pertimbangkan harga untuk menembus garis rata-rata SMA dan resistance level untuk menangkap peluang tren.
- Dengan memperkenalkan indikator volume transaksi, memastikan bahwa harga terobosan disertai dengan keterlibatan pasar yang cukup, meningkatkan efektivitas sinyal.
- Mengatur kondisi stop loss, secara efektif mengendalikan risiko perdagangan.
Analisis risiko
- Perhitungan untuk mendukung resistance level bergantung pada data historis dan mungkin tidak akan efektif jika terjadi fluktuasi besar di pasar.
- Indikator volume transaksi mungkin mengalami fluktuasi yang tidak biasa, yang menyebabkan sinyal yang salah.
- Penetapan kondisi stop loss mungkin tidak dapat sepenuhnya menghindari kerugian dalam situasi ekstrim pasar.
Arah optimasi
- Pertimbangkan untuk memperkenalkan indikator teknis lainnya, seperti RSI atau MACD, untuk lebih memvalidasi keandalan sinyal perdagangan.
- Optimalkan metode perhitungan untuk mendukung resistance level, misalnya dengan menggunakan metode yang lebih dinamis untuk menyesuaikan dengan kondisi pasar yang berbeda.
- Pengolahan indikator volume transaksi yang halus untuk mengurangi dampak dari fluktuasi yang tidak biasa pada strategi.
- Pengaturan untuk mengoptimalkan kondisi stop loss, seperti menggunakan stop loss yang bergerak atau menyesuaikan persentase stop loss secara dinamis sesuai dengan pergerakan pasar.
Meringkaskan
Strategi ini dengan menggabungkan SMA rata-rata, dukungan resistance level dan volume perdagangan indikator, membangun strategi perdagangan yang komprehensif. Keunggulan dari strategi ini adalah mampu menangkap peluang tren, sementara mengendalikan risiko perdagangan. Namun, strategi ini juga memiliki beberapa keterbatasan, seperti kemampuan untuk beradaptasi dengan kondisi pasar yang ekstrim akan meningkat.
- 1